




Bitcoin price surged past $68,000 late Wednesday as a break above crowded liquidation levels forced short sellers to buy back positions, turning a gradual recovery into a one-minute price spike of roughly 4%.
Summary
- Bitcoin price jumped from below $65,000 to a high near $69,500 before settling around $68,500.
- More than $1 billion in crypto shorts were reportedly liquidated within one hour.
- The breakout cleared a 4-hour double-bottom neckline near $65,400.
- Bitcoin now faces daily resistance between $69,000 and $70,000 after its RSI entered overbought territory.
Market analyst Daan Crypto Trades said in an Aug. 19 X post that Bitcoin experienced a “massive squeeze” after crossing the $67,000 liquidation cluster. He said the resulting one-minute candle gained about 4%, exceeding the size of any full daily candle recorded in recent weeks.
Bitcoin price clears a two-month trading range
According to data from crypto.news, Bitcoin (BTC) price traded near $68,500 at the time of writing after reaching an intraday high of about $69,500 on Binance. The move represented a gain of nearly 6% from Wednesday’s opening price of around $64,725.
The rally followed several weeks of limited movement between approximately $62,000 and $66,000. Buyers had repeatedly failed to hold above $65,000, encouraging traders to build leveraged short positions around the upper end of that range.
Bitcoin reversed the setup within minutes. Once BTC price crossed $67,000, exchanges began closing positions that no longer had enough collateral, requiring short sellers to buy Bitcoin and adding further upward pressure.
The broader crypto market recorded more than $1 billion in short liquidations within one hour as Bitcoin climbed above $69,000. Total crypto short liquidations later reached $1.79 billion, suggesting that forced buying played a major role in accelerating the rally.
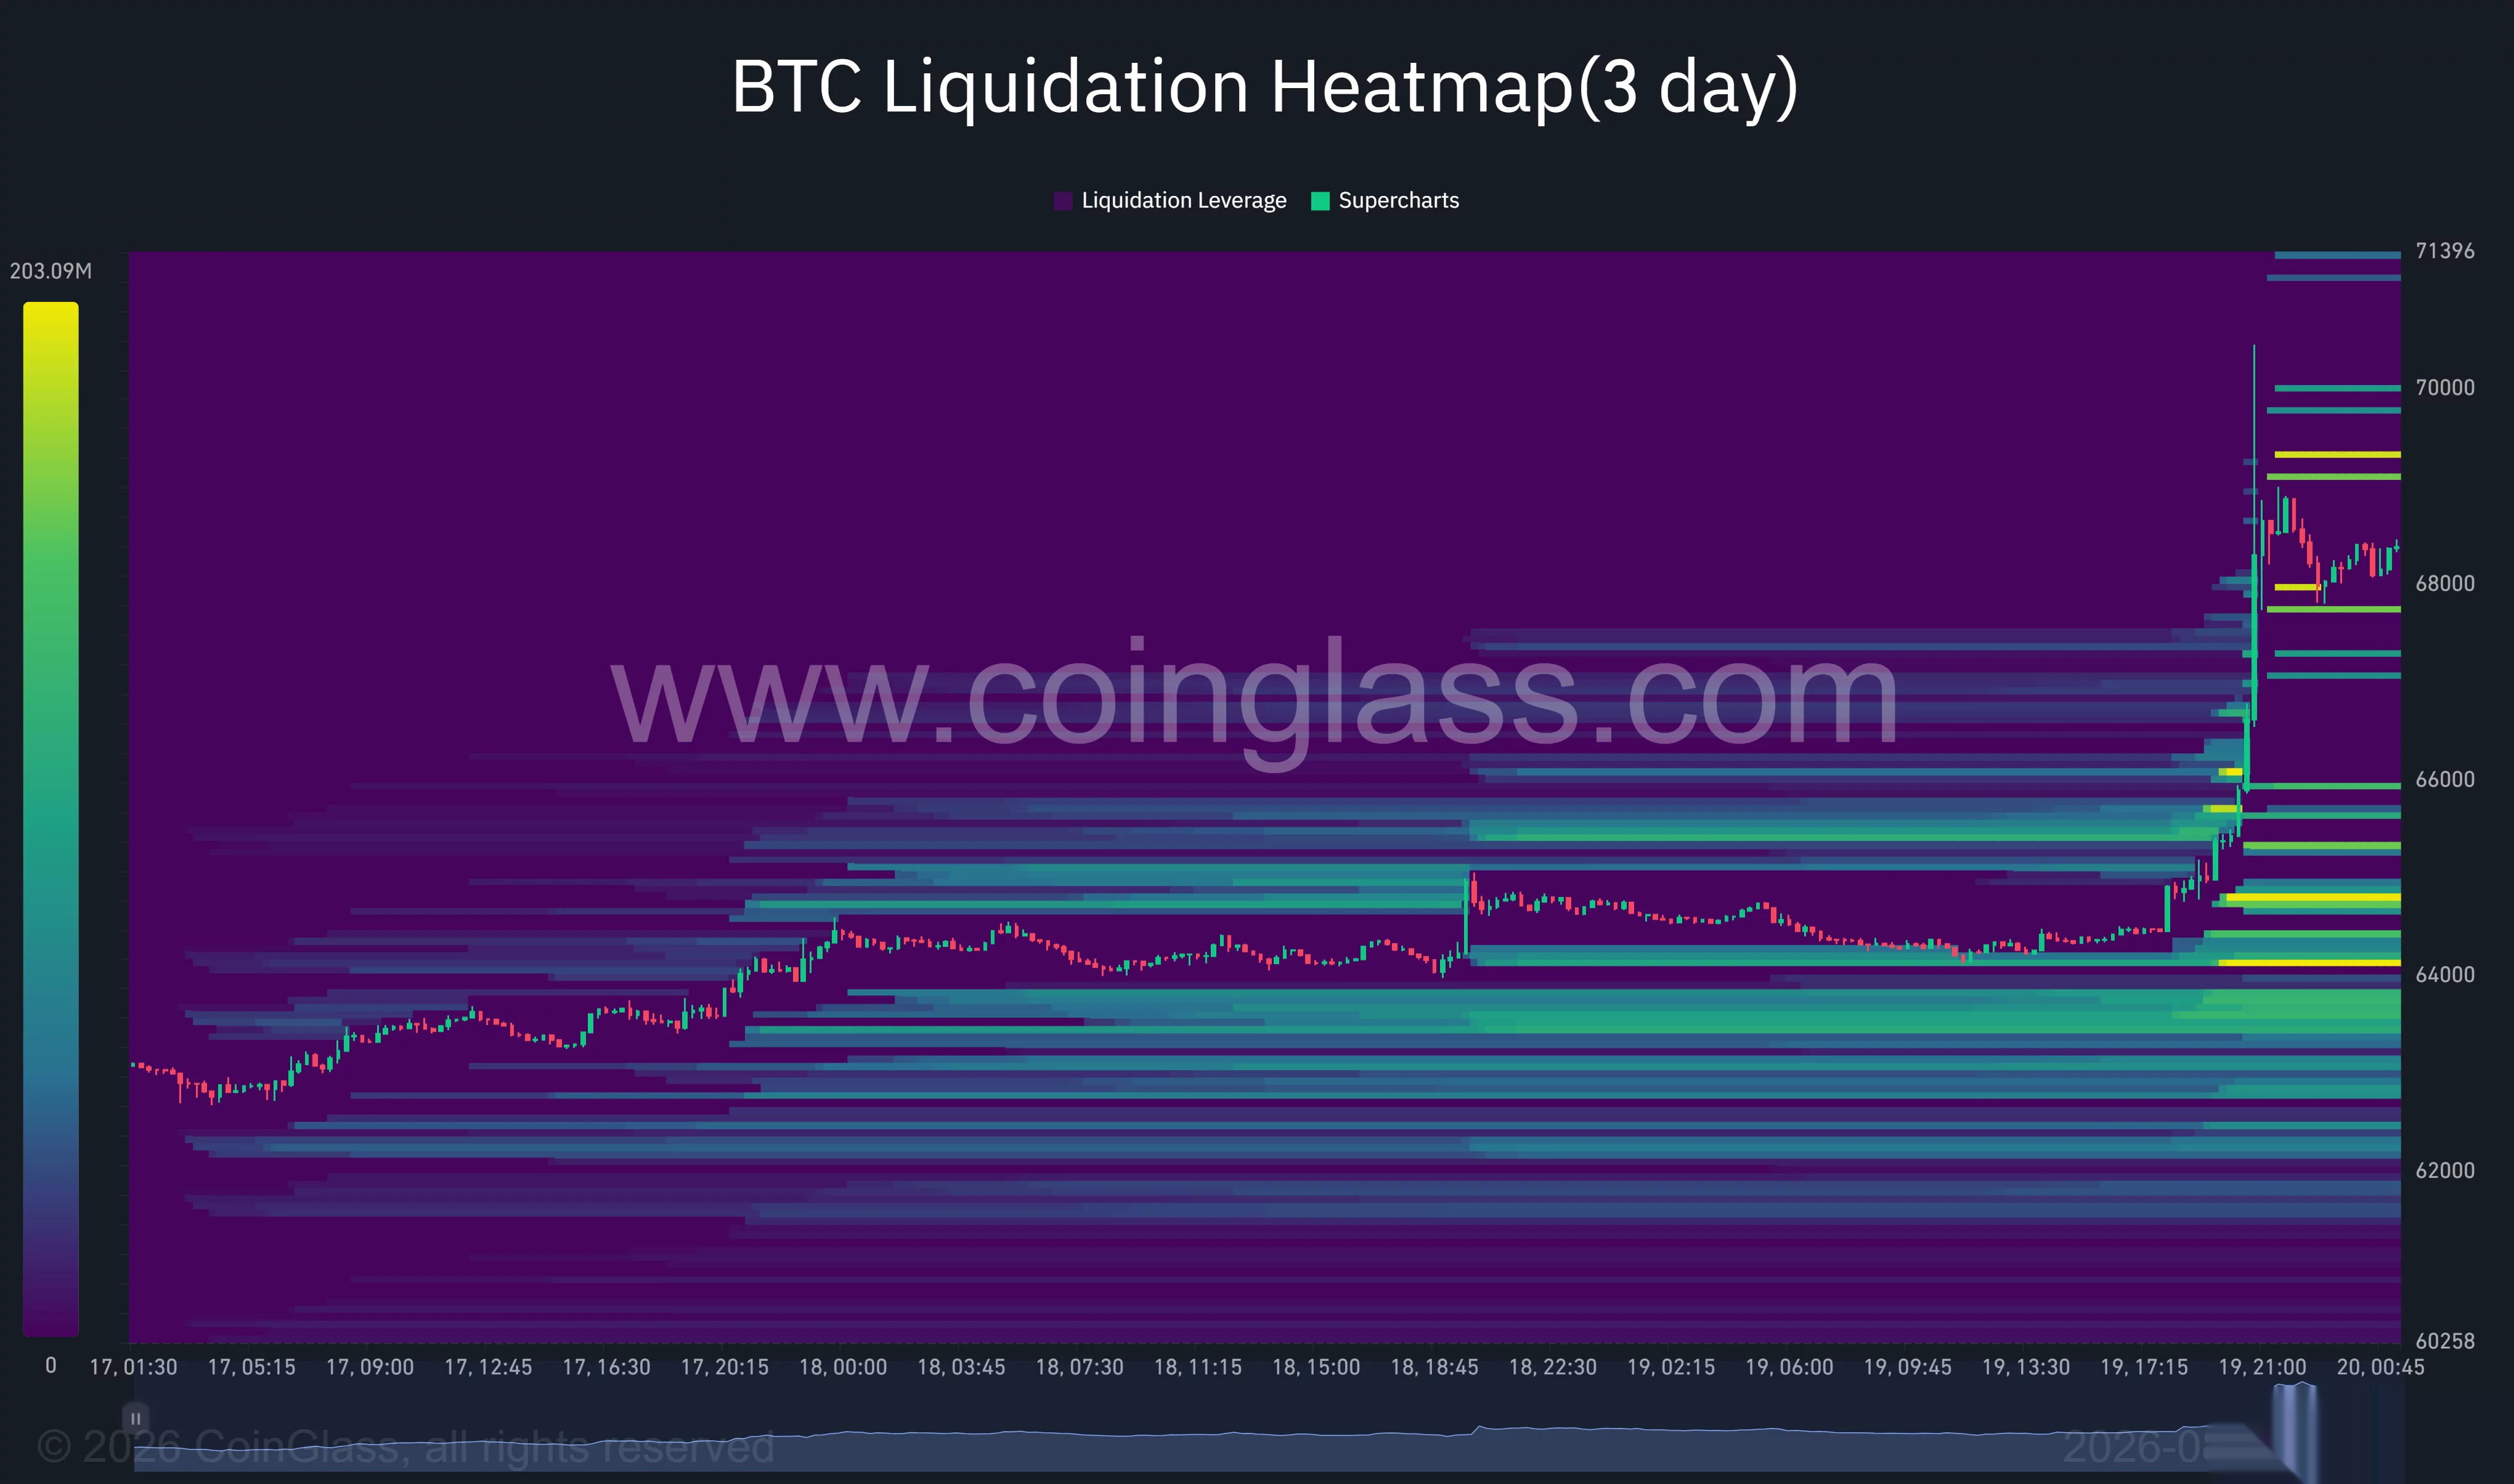
The three-day CoinGlass heatmap shows Bitcoin moving through multiple liquidation bands between $65,000 and $67,500 before reaching the upper cluster near $69,000. Much of the liquidity that had built above the previous trading range was therefore removed during the spike.
Treasury buybacks and SEC proposal support risk appetite
The squeeze followed a U.S. Treasury announcement that it would at least double the maximum size of liquidity-support buybacks for longer-dated government bonds.
Starting Sept. 9, the Treasury plans to raise the maximum purchase size for 10- to 30-year securities from $2 billion to at least $4 billion per operation. Long-term Treasury yields fell after the announcement, while the dollar weakened and US stocks advanced.
Lower bond yields can improve demand for risk assets by reducing the return available from government debt, although the Treasury described its purchases as a way to improve market liquidity rather than a monetary stimulus program.
Bitcoin also benefited from a more favorable US regulatory backdrop after the Securities and Exchange Commission proposed its new “Regulation Crypto Assets” framework on Aug. 18.
According to the SEC proposal, the framework would create tailored registration exemptions for certain crypto-related investment contracts. One exemption would allow eligible startups to raise up to $5 million over four years, while another would permit qualifying issuers to raise as much as $75 million in a 12-month period, subject to disclosures and other requirements.
The proposal has not taken effect and may change following public feedback. Its publication nevertheless added to expectations that US crypto companies could receive clearer fundraising rules.
Bitcoin breakout targets the $69,000 resistance zone
The 4-hour Bitcoin chart shows a double-bottom structure formed between late July and mid-August. Both lows developed near $62,200, while the neckline sat around $65,400.
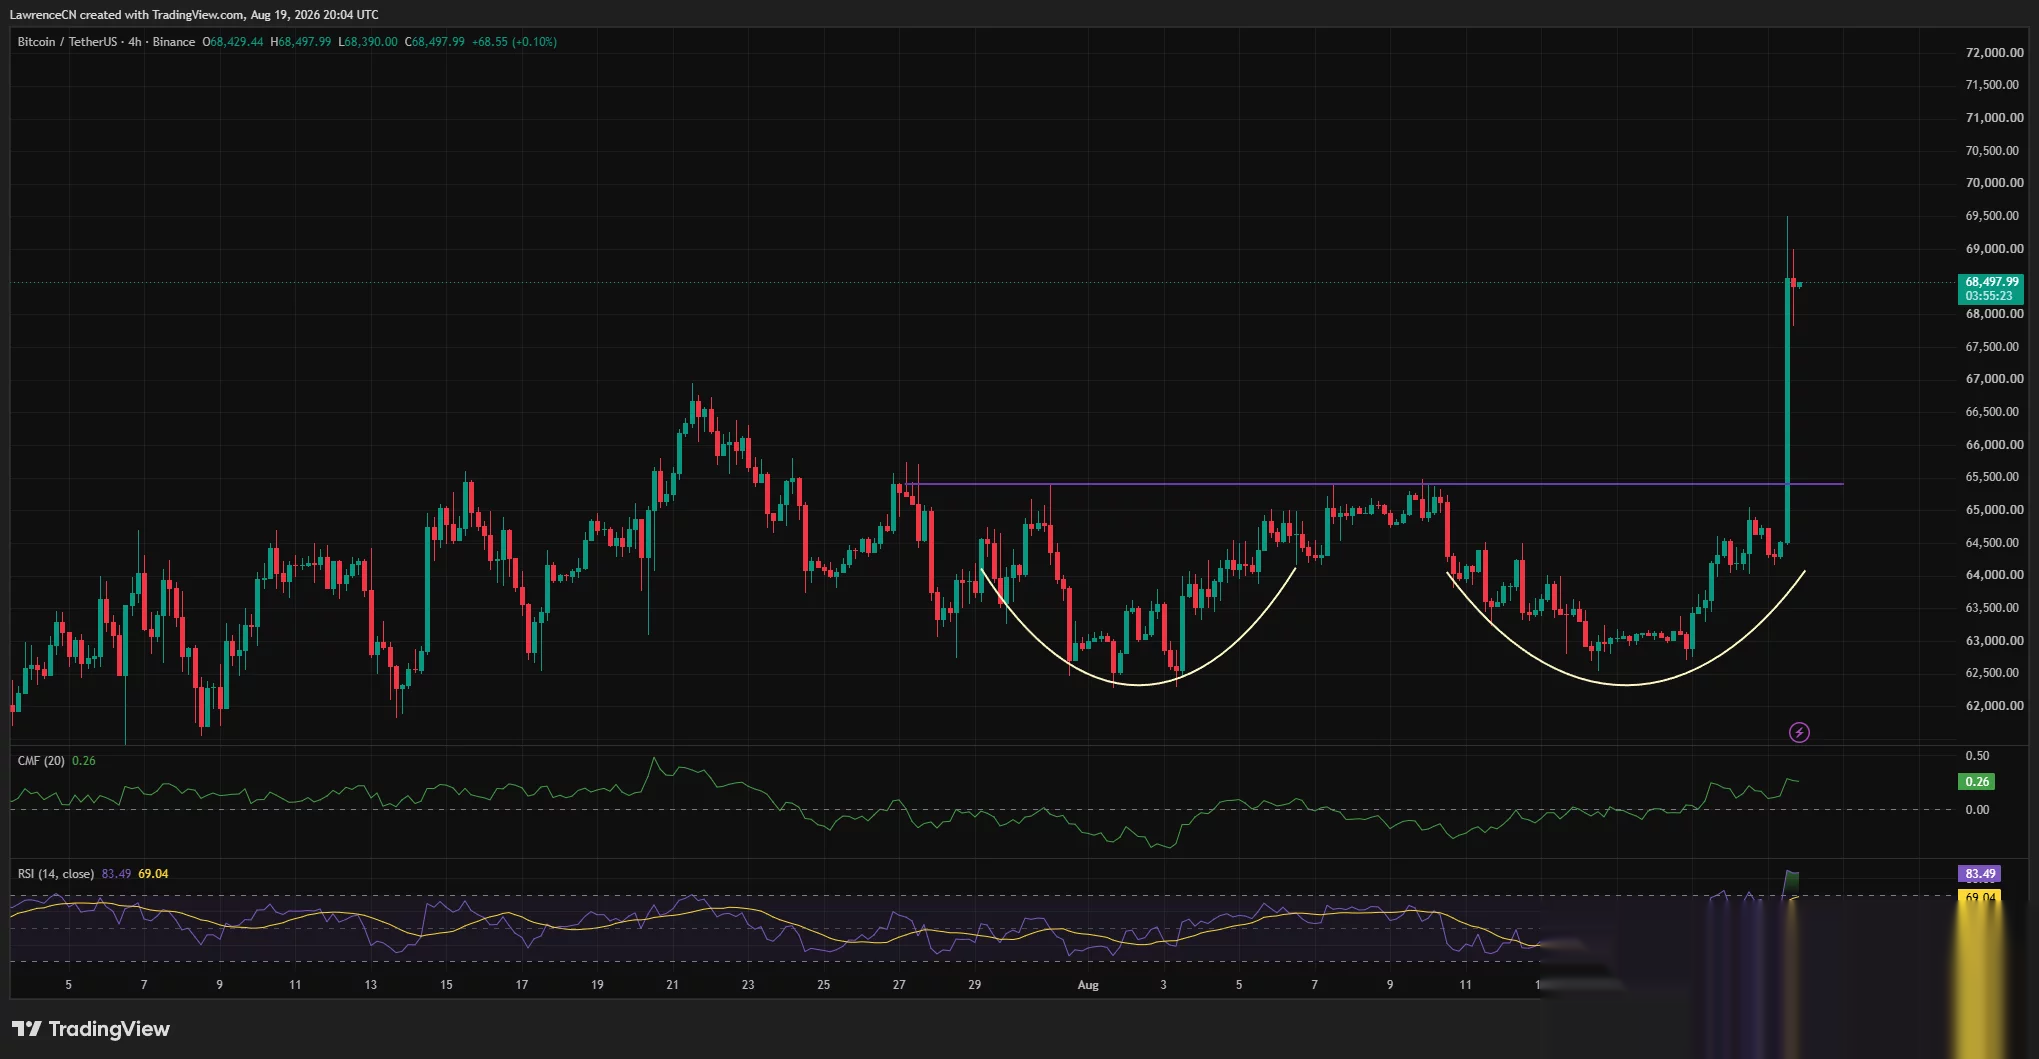
Wednesday’s move broke through that neckline with one large candle, placing Bitcoin roughly $3,000 above the former resistance level. The pattern’s measured move points toward the $68,500–$69,000 region, which Bitcoin reached during the breakout.
Capital flow also strengthened alongside the price. The 4-hour Chaikin Money Flow reading rose to 0.26, indicating that buying pressure outweighed selling pressure during the move.
Short-term conditions have become stretched, however. The 4-hour relative strength index reached 83.49, well above the 70 level commonly associated with an overbought market. The RSI average stood near 69, showing how quickly momentum increased.
An overbought RSI does not require an immediate decline, especially during a short squeeze, but it raises the risk of profit-taking or a retest of the breakout. The long upper wick near $69,500 shows that sellers already responded above $69,000.
On the daily chart, Bitcoin reclaimed its 100-day simple moving average around $66,288. Price remained slightly below the 200-day average near $69,031, making the $69,000–$70,000 area the next test for the recovery.
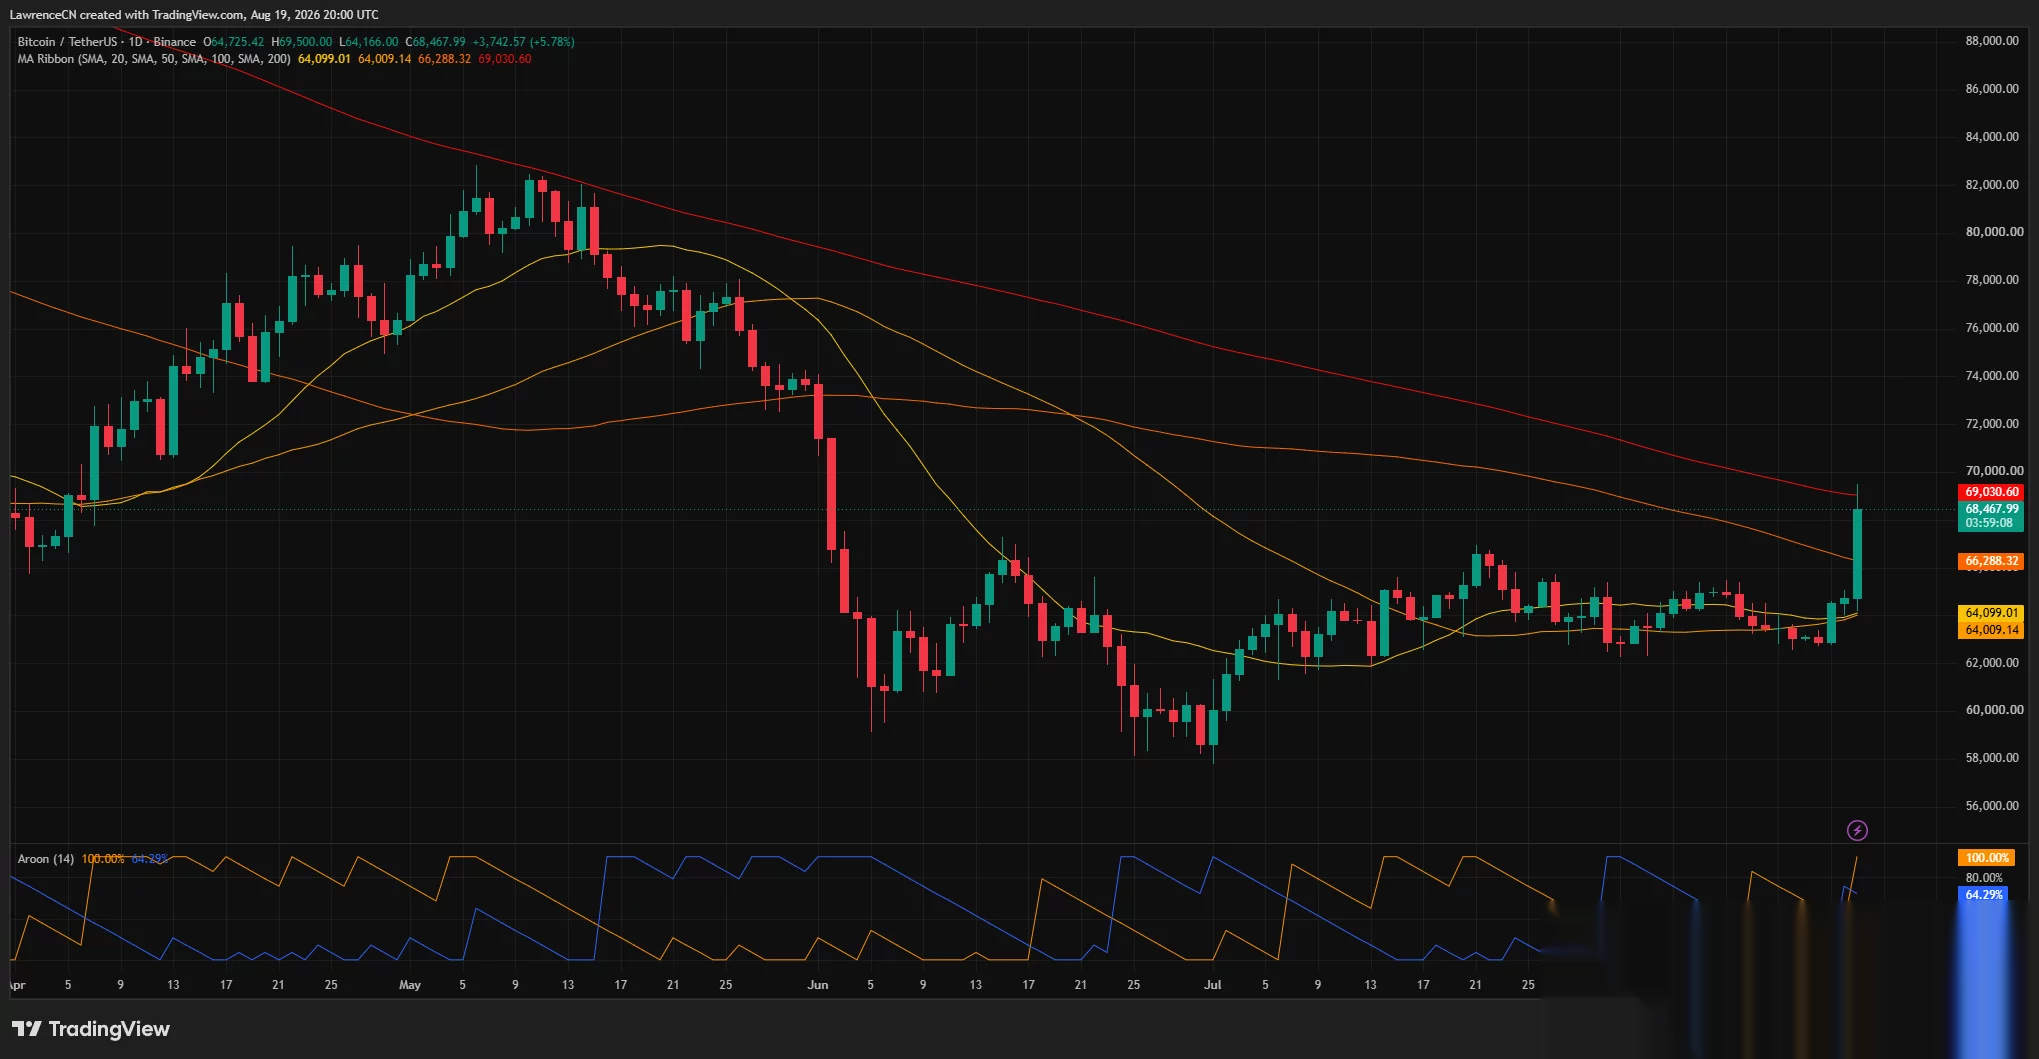
A daily close above that zone would improve the case for a move toward $72,000. Analyst Ted Pillows identified $74,000 as the more important weekly level, arguing that reclaiming it would reduce the likelihood of Bitcoin falling below $55,000.
Failure to hold the breakout could return attention to $67,000, followed by the former neckline around $65,400. The strongest nearby support cluster visible on the liquidation heatmap sits between approximately $64,000 and $65,500.
Zhang’s pre-breakout outlook still warns against chasing
Before Wednesday evening’s breakout, Bitget Wallet research analyst Lacie Zhang told crypto.news that Bitcoin was showing evidence of a bottoming process but had not yet established a confirmed bottom.
At the time of her comments, Bitcoin was trading between $64,000 and $64,700 after holding a multi-week range between $62,000 and $66,000. Zhang pointed to moderate leverage, compressed volatility, and slower selling by long-term holders as factors reducing the likelihood of a sharp move in either direction.
“Bitcoin is showing signs of a bottoming process, but not a confirmed bottom,” Zhang said before the rally.
“If $60,000–$62,000 support holds, the setup offers asymmetric upside; confirmation of a durable bottom still requires sustained volume and less fear.”
The subsequent move invalidated the immediate expectation that Bitcoin would remain confined below $66,000, but it did not settle Zhang’s broader question about whether the market has established a durable low. The breakout relied partly on forced short covering, while the 4-hour RSI and rejection near the 200-day average leave room for a pullback.
Zhang expects Bitcoin to trade within a broad $55,000–$80,000 range through year-end. Holding above $65,400 after the initial squeeze would provide stronger evidence that spot buyers, rather than liquidations alone, can support the latest recovery.