

Six weeks of bearish positioning ended in 24 hours. Here is how the trade unwound, who got caught, and whether the squeeze has legs.
Summary
- More than $3 billion in leveraged short positions were liquidated across crypto derivatives markets on Aug 19 and 20, 2026, making it the eighth largest liquidation event on record and the largest concentrated short squeeze since November 2021.
- Bitcoin climbed from an intraday low near $64,100 to a peak above $72,000, while Ethereum surged roughly 18% in 24 hours, its strongest single day move since March 2024.
- The U.S. Treasury doubled the maximum size of its liquidity support buyback operations for long dated bonds from $2 billion to $4 billion per operation, compressing yields and pushing risk assets higher.
- Binance absorbed approximately $518 million in liquidations, Hyperliquid roughly $513 million, and Bybit around $303 million, with short positions accounting for 92% of all forced closures.
- The expanded buyback program runs only through Nov. 4, 2026. If long end yields stabilize by then, there is no guarantee that the larger operation size continues, limiting the macro tailwind.
Crypto derivatives markets had been building toward this moment for six weeks. Open interest in Bitcoin perpetual futures climbed steadily through July, with funding rates drifting negative as traders added to short positions. Bearish bets outnumbered bullish ones on every major exchange. On Binance, shorts held 51.64% of open interest. On OKX, 51.13%. On Bybit, 52.25%. The consensus was clear: the market was going lower.
Then, over the span of 24 hours, it went violently higher.
What triggered the squeeze
The first catalyst landed on Aug. 19 at approximately 2:30 PM UTC, when the U.S. Treasury announced it would at least double the maximum size of its liquidity support buyback operations for 10 to 20 year and 20 to 30 year nominal coupon securities. The cap moved from $2 billion to $4 billion per operation, effective Sep. 9 through Nov. 4.
Treasury buybacks are not quantitative easing. The department buys back illiquid, off the run bonds and replaces them with fresh, on the run issuance. The net effect on the government balance sheet is roughly neutral. But the market impact is not. By removing duration from the market, buybacks compress long end yields and improve liquidity conditions across risk assets. For more on the mechanics, see our breakdown of how the $4 billion Treasury buyback moved Bitcoin 8% in a day.
Bitcoin responded within minutes. The price moved from $64,100 to $66,800 in the first hour after the announcement. That initial move was enough to trigger the first wave of margin calls on leveraged shorts, and the cascade began.
The liquidation cascade
The mechanics of a short squeeze in crypto derivatives are straightforward but brutal. When a short position on a perpetual futures contract falls below its maintenance margin, the exchange liquidates it by placing a market buy order. That buy order pushes the price higher, which triggers more liquidations, which generates more buy orders. The feedback loop continues until the selling pressure from remaining shorts can absorb the forced buying.
On Aug. 19 and 20, the loop ran for roughly 18 hours before stabilizing.
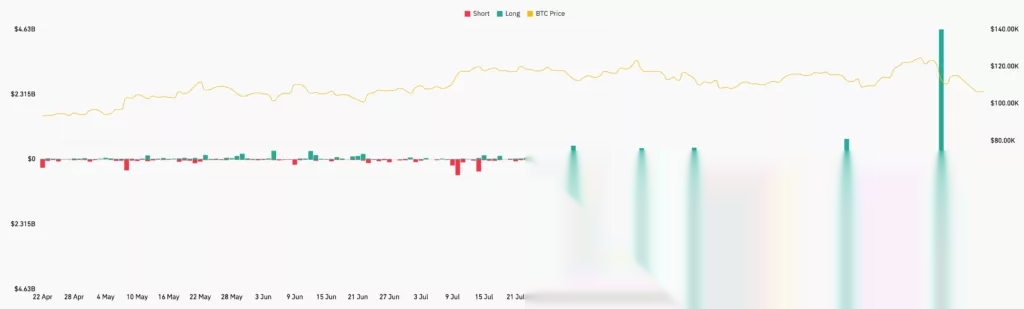
Total liquidations across all major exchanges exceeded $3 billion. Short positions accounted for approximately $2.77 billion, or 92% of the total. Long liquidations were a rounding error at $264 million. According to CoinGlass data, roughly $1.29 billion in short positions closed within a single hour, the fastest concentrated squeeze of 2026. As we reported when Bitcoin first broke past $68K on the initial $1 billion short squeeze wave, the cascade was just beginning.
The breakdown by exchange reveals how concentrated the pain was. Binance saw approximately $518 million in liquidations. Hyperliquid, the decentralized perpetuals exchange that has grown rapidly this year, absorbed roughly $513 million. Bybit recorded around $303 million. The remaining liquidations spread across OKX, dYdX, and smaller venues.
Bitcoin shorts accounted for approximately $1.37 billion of the total, while Ethereum shorts contributed roughly $1.01 billion. The remainder came from altcoin positions, with Solana, XRP, and Dogecoin among the most affected.
The exchange level data reveals a secondary pattern that the headline numbers obscure. On Hyperliquid, a decentralized exchange that does not use a traditional order book for liquidations, the insurance fund absorbed roughly $47 million in losses during the cascade. The fund, which stood at approximately $380 million before the event, dropped to $333 million by the time the squeeze stabilized. On Binance, the auto deleveraging system activated twice during the peak liquidation hour, forcing profitable long traders to partially close their positions to cover the counterparty shortfall. These mechanisms prevented cascading failures at the exchange level but added to the speed and violence of the price move.
The altcoin liquidation data adds granularity that the Bitcoin and Ethereum headlines miss. Solana perpetual futures saw approximately $187 million in short liquidations, driven by the same macro catalysts plus the additional momentum from cumulative SOL ETF inflows crossing $1.16 billion earlier in the week. XRP shorts lost roughly $142 million, with the asset rallying 10% alongside the broader market. Dogecoin, which had seen a buildup of speculative short positions during a quiet July, contributed approximately $89 million. These figures matter because altcoin liquidations tend to be more violent per dollar of open interest. Altcoin perpetual markets are thinner, with fewer market makers and wider spreads. When liquidations cascade through these markets, the price impact per dollar liquidated is significantly larger than in Bitcoin or Ethereum.
Why the positioning was so extreme
The bearish lean in crypto derivatives markets did not appear overnight. It built over six weeks, from early July through mid August, during a period when multiple headwinds converged.
The CLARITY Act, the most comprehensive crypto market structure bill to reach the Senate floor, stalled after its procedural vote was postponed to September. The SEC finalized its “Regulation Crypto Assets” framework, which some market participants interpreted as an attempt to preempt Congressional legislation. For more on how these two frameworks conflict, see our analysis of SEC regulation crypto assets vs the CLARITY Act. Bitcoin had traded in a narrowing range between $60,000 and $66,000 since late June, with each rally attempt meeting selling pressure near the upper bound.
Funding rates on Bitcoin perpetual futures turned negative in late July and stayed negative through mid August, meaning that short traders were being paid to hold their positions. That dynamic attracted more shorts, creating a self reinforcing cycle of bearish positioning.
The numbers tell the story precisely. On Aug. 18, one day before the squeeze, the eight hour funding rate on Binance Bitcoin perpetual futures stood at negative 0.012%, a level that had persisted for three consecutive weeks. At negative funding, traders holding short positions receive a payment from traders holding long positions every eight hours. The payment is small in absolute terms but compounds meaningfully over weeks. A trader with a $10 million short position at negative 0.012% funding received approximately $3,600 per day simply for maintaining the position. That dynamic attracted capital into shorts not because of a directional thesis but because of the yield. When the forced unwind came, many of these yield seeking shorts had no thesis to defend and no plan for a stop loss.
The result was a market that was heavily one sided. When the Treasury announcement provided a fundamental reason for risk assets to rally, the positioning was too extreme to absorb the move without forced buying.
The second catalyst: the White House summit
The Treasury announcement alone might not have been sufficient to produce a $3 billion liquidation event. But it was followed within hours by reports that President Trump would host a crypto industry summit at the White House, attended by senior SEC officials and executives from major exchanges.
The summit, confirmed for late August, signaled that the administration remained committed to a regulatory framework favorable to the crypto industry. Coming on top of the Treasury buyback expansion, it created a second wave of short covering that pushed Bitcoin from $68,000 to above $71,000 on Aug. 20.
The combined effect of both catalysts was greater than either alone. The Treasury announcement provided the fundamental case for higher prices. The White House summit provided the narrative. Together, they forced the most aggressive unwind of bearish positioning since the collapse of FTX sent the market into a tailspin in November 2022.
How Ethereum outperformed
Ethereum’s 18% single day move was the standout of the squeeze. While Bitcoin gained roughly 8%, Ethereum outperformed by a factor of more than two. The reason lies in the composition of the short positions that were liquidated.
Ethereum shorts on major exchanges had grown disproportionately through July and August, partly because of skepticism about the Pectra upgrade timeline and partly because of persistent outflows from Ethereum spot ETFs. The net short positioning in Ethereum perpetual futures was, relative to open interest, more extreme than in Bitcoin.
When the squeeze began, Ethereum’s thinner order books amplified the price impact. Trading volume on Ethereum pairs surged 402% in 24 hours, according to AMBCrypto data. The asset moved from approximately $1,920 to above $2,270 before stabilizing near $2,250. For our full Ethereum price prediction, see our dedicated analysis.
The rally also exposed a structural risk in DeFi. On Aave, the largest decentralized lending protocol, just 9% of positions carry roughly half of the platform’s total debt. These positions are built around a leveraged Ethereum staking correlation trade, using WETH debt against liquid staking collateral like weETH, rsETH, and wstETH. The average health factor on these positions sits near 1.06, meaning an 8% to 9% wrapper discount could trigger a liquidation cascade on chain.
The staking correlation trade that dominates Aave’s risk profile operates on a simple premise that conceals significant complexity. A trader deposits weETH, a liquid restaking token issued by EtherFi, as collateral on Aave. The trader then borrows WETH against that collateral at a loan to value ratio near 90%. The borrowed WETH is restaked through EtherFi to produce more weETH, which is deposited again as collateral. Each loop multiplies both the staking yield and the leverage. At 10 times leverage, the effective annual yield on the trader’s equity approaches 40% to 50% before accounting for borrowing costs and gas fees. The trade is profitable as long as weETH maintains its peg to ETH within a narrow band. The moment the wrapper discount exceeds the health factor buffer, the entire recursive structure unwinds through liquidation.
The Aug. 20 rally did not trigger that cascade because ETH moved higher, not lower. But the concentration of risk in a small number of highly leveraged positions remains a vulnerability. If Ethereum corrects sharply from current levels, the same positions that survived the upside squeeze could face liquidation on the way down.
The institutional side of the trade added another layer to Ethereum’s outperformance. U.S. spot Ethereum ETFs, which had recorded net outflows for much of July and early August, posted net inflows of approximately $189 million on Aug. 19 alone. The reversal in ETF flows suggests that institutional investors were not only covering short positions in derivatives but also adding long exposure through regulated products. Weekly ETF inflow figures strengthened in tandem, signaling that the squeeze may have catalyzed a broader reassessment of Ethereum’s near term prospects among allocators who had been underweight the asset.
What the data says about follow through
Not every short squeeze leads to a sustained rally. The question is whether the forced buying created genuine demand or simply cleared out weak hands.
The evidence is mixed. On one hand, Bitcoin’s move above $72,000 broke a six week trading range and set a new short term high. Open interest has declined by approximately 15% since the squeeze, suggesting that leveraged positioning has been significantly reduced. Funding rates have turned positive, indicating that the market is no longer paying traders to be short.
On the other hand, the fundamental catalyst has a built in expiration date. The Treasury’s expanded buyback program runs only through Nov. 4, 2026. After that window closes, Treasury will reassess whether to maintain the larger operation size. If long end yields have stabilized by then, there is no guarantee that the program continues at its current scale.
The derivatives market structure itself has changed in ways that make comparisons to previous squeezes imprecise. Hyperliquid did not exist during the November 2021 squeeze. The decentralized exchange now handles roughly 15% of all crypto perpetual futures volume, and its liquidation mechanism operates differently from centralized exchanges. On Hyperliquid, liquidations are processed through a decentralized backstop pool rather than an insurance fund controlled by a single entity. The pool’s participants absorb losses in exchange for a share of liquidation fees during normal operations. During the Aug. 19 cascade, backstop participants absorbed approximately $47 million in losses, raising questions about whether the pool’s capitalization is sufficient for events of this magnitude.
The macro backdrop also remains uncertain. The Federal Reserve has not signaled rate cuts, and the next FOMC meeting in September could introduce volatility regardless of the crypto specific catalysts. The interplay between macro policy and crypto positioning has rarely been this tight, and the next two weeks will determine whether the squeeze was a reset or a turning point.
Historical parallels
The Aug. 19 squeeze is the eighth largest liquidation event in crypto history by total dollar value. But context matters. Measured as a percentage of total open interest, it ranks higher because the derivatives market in 2026 is smaller than it was during the 2021 bull market peak.
The closest parallel is the November 2021 squeeze that followed Bitcoin’s run to $69,000, which produced roughly $4.2 billion in liquidations. That event marked a local top. The March 2024 squeeze, which preceded Bitcoin’s all time high above $73,000, produced approximately $2.1 billion in liquidations and preceded a sustained rally. The bank custody race that followed the March squeeze suggests institutional infrastructure was a key factor in sustaining that rally.
The difference between a top signal and a continuation signal lies in what happens to open interest after the squeeze. If new positions rebuild quickly on the long side, the market may be setting up for another round of leverage driven volatility. If open interest stays depressed, the squeeze may have cleared the decks for a more organic move higher.
Another variable that distinguishes 2026 from previous squeeze events is the regulatory environment. In November 2021, crypto regulation in the United States was largely absent. By August 2026, the SEC has finalized its Regulation Crypto Assets framework, the CLARITY Act is moving through the Senate, and multiple spot crypto ETFs trade on regulated exchanges. This regulatory infrastructure creates both a floor and a ceiling for price action. The floor comes from institutional capital that can now access crypto through regulated products. The ceiling comes from the compliance costs and operational constraints that regulation imposes on market participants. Whether the post squeeze rally finds sustained support may depend less on derivatives positioning and more on whether the regulatory catalysts produce concrete outcomes before their momentum fades.
What to watch
The aftermath of a squeeze of this magnitude typically unfolds over two to four weeks. The initial move is mechanical, driven by forced buying. The follow through depends on whether new capital enters the market or whether the same participants simply reposition. In 2024, the March squeeze preceded a sustained rally because spot Bitcoin ETFs were absorbing supply at a rate that exceeded the forced buying from liquidations. In 2026, the question is whether the combination of Treasury buyback expansion, a potential White House summit, and the CLARITY Act’s September procedural vote creates a similar supply absorption dynamic or whether the squeeze was a one time clearing event that exhausts bullish momentum. The answer lies in the data that will emerge over the next 14 days, and five indicators in particular deserve close monitoring.
- Funding rates over the next two weeks. If perpetual funding stays positive but moderate (below 0.03% per eight hours), the market is resetting rather than overheating. If funding spikes above 0.05%, leveraged longs are replacing the liquidated shorts, recreating the same vulnerability in the opposite direction.
- Treasury buyback execution from Sep. 9. The first operation under the expanded program will reveal whether the $4 billion cap is the floor or the ceiling. Larger than expected operations would compress yields further and support risk assets.
- Aave health factors on the wstETH/weETH correlation trade. The 9% of positions carrying half of Aave’s debt have average health factors near 1.06. A sharp ETH correction of 8% or more could trigger on chain liquidations that amplify the move.
- Open interest rebuild pace. If total open interest on Bitcoin perpetual futures recovers to pre squeeze levels within 10 days, traders are re leveraging quickly and another squeeze (in either direction) becomes likely.
- White House crypto summit outcomes. The late August meeting between the administration and crypto industry executives could produce concrete policy signals that either sustain or undercut the current rally.
What caused the $3 billion crypto short squeeze on Aug. 19?
The U.S. Treasury doubled its liquidity support buyback operations for long dated bonds from $2 billion to $4 billion per operation. The announcement compressed yields, pushed risk assets higher, and triggered a cascade of margin calls on leveraged short positions across crypto derivatives markets.
How much were total crypto liquidations on Aug. 19 and 20?
Total liquidations exceeded $3 billion across major exchanges, with short positions accounting for approximately $2.77 billion (92%) and long liquidations totaling roughly $264 million.
Which exchanges had the most liquidations?
Binance recorded approximately $518 million, Hyperliquid roughly $513 million, and Bybit around $303 million. The remainder spread across OKX, dYdX, and smaller venues.
Why did Ethereum outperform Bitcoin during the squeeze?
Ethereum had more extreme net short positioning relative to open interest, thinner order books, and a 402% surge in trading volume. These factors amplified the price impact, producing an 18% gain compared to Bitcoin’s roughly 8%.
Is the Treasury buyback program permanent?
No. The expanded $4 billion per operation program runs only from Sep. 9 through Nov. 4, 2026. Treasury will reassess after that window closes based on whether long end yields have stabilized.
What is the Aave concentration risk related to the Ethereum rally?
Just 9% of Aave positions carry roughly half of the platform’s total debt. These positions use leveraged Ethereum staking correlation trades with average health factors near 1.06. An 8% to 9% wrapper discount could trigger on chain liquidations.
How does this squeeze rank historically?
It is the eighth largest liquidation event in crypto history by total dollar value. By percentage of total open interest liquidated, it ranks higher because the 2026 derivatives market is smaller than the 2021 peak.
Could the squeeze reverse quickly?
If the Treasury buyback program does not continue after Nov. 4 and the Federal Reserve maintains restrictive monetary policy, the macro tailwind driving the rally could fade. However, the reduction in open interest suggests that leveraged positioning has been cleared, reducing the risk of an immediate reversal. This is educational analysis, not investment advice.