
Bitcoin can appear to move with equities, gold, or broad risk sentiment in one sample and not in another. That is not necessarily a contradiction. Correlation is a statistic describing how two chosen series moved over a chosen interval; it is not a permanent label attached to an asset. A useful explanation starts by naming the data, transforming prices into comparable observations, and asking what shared conditions could be present before drawing a conclusion from a single number.
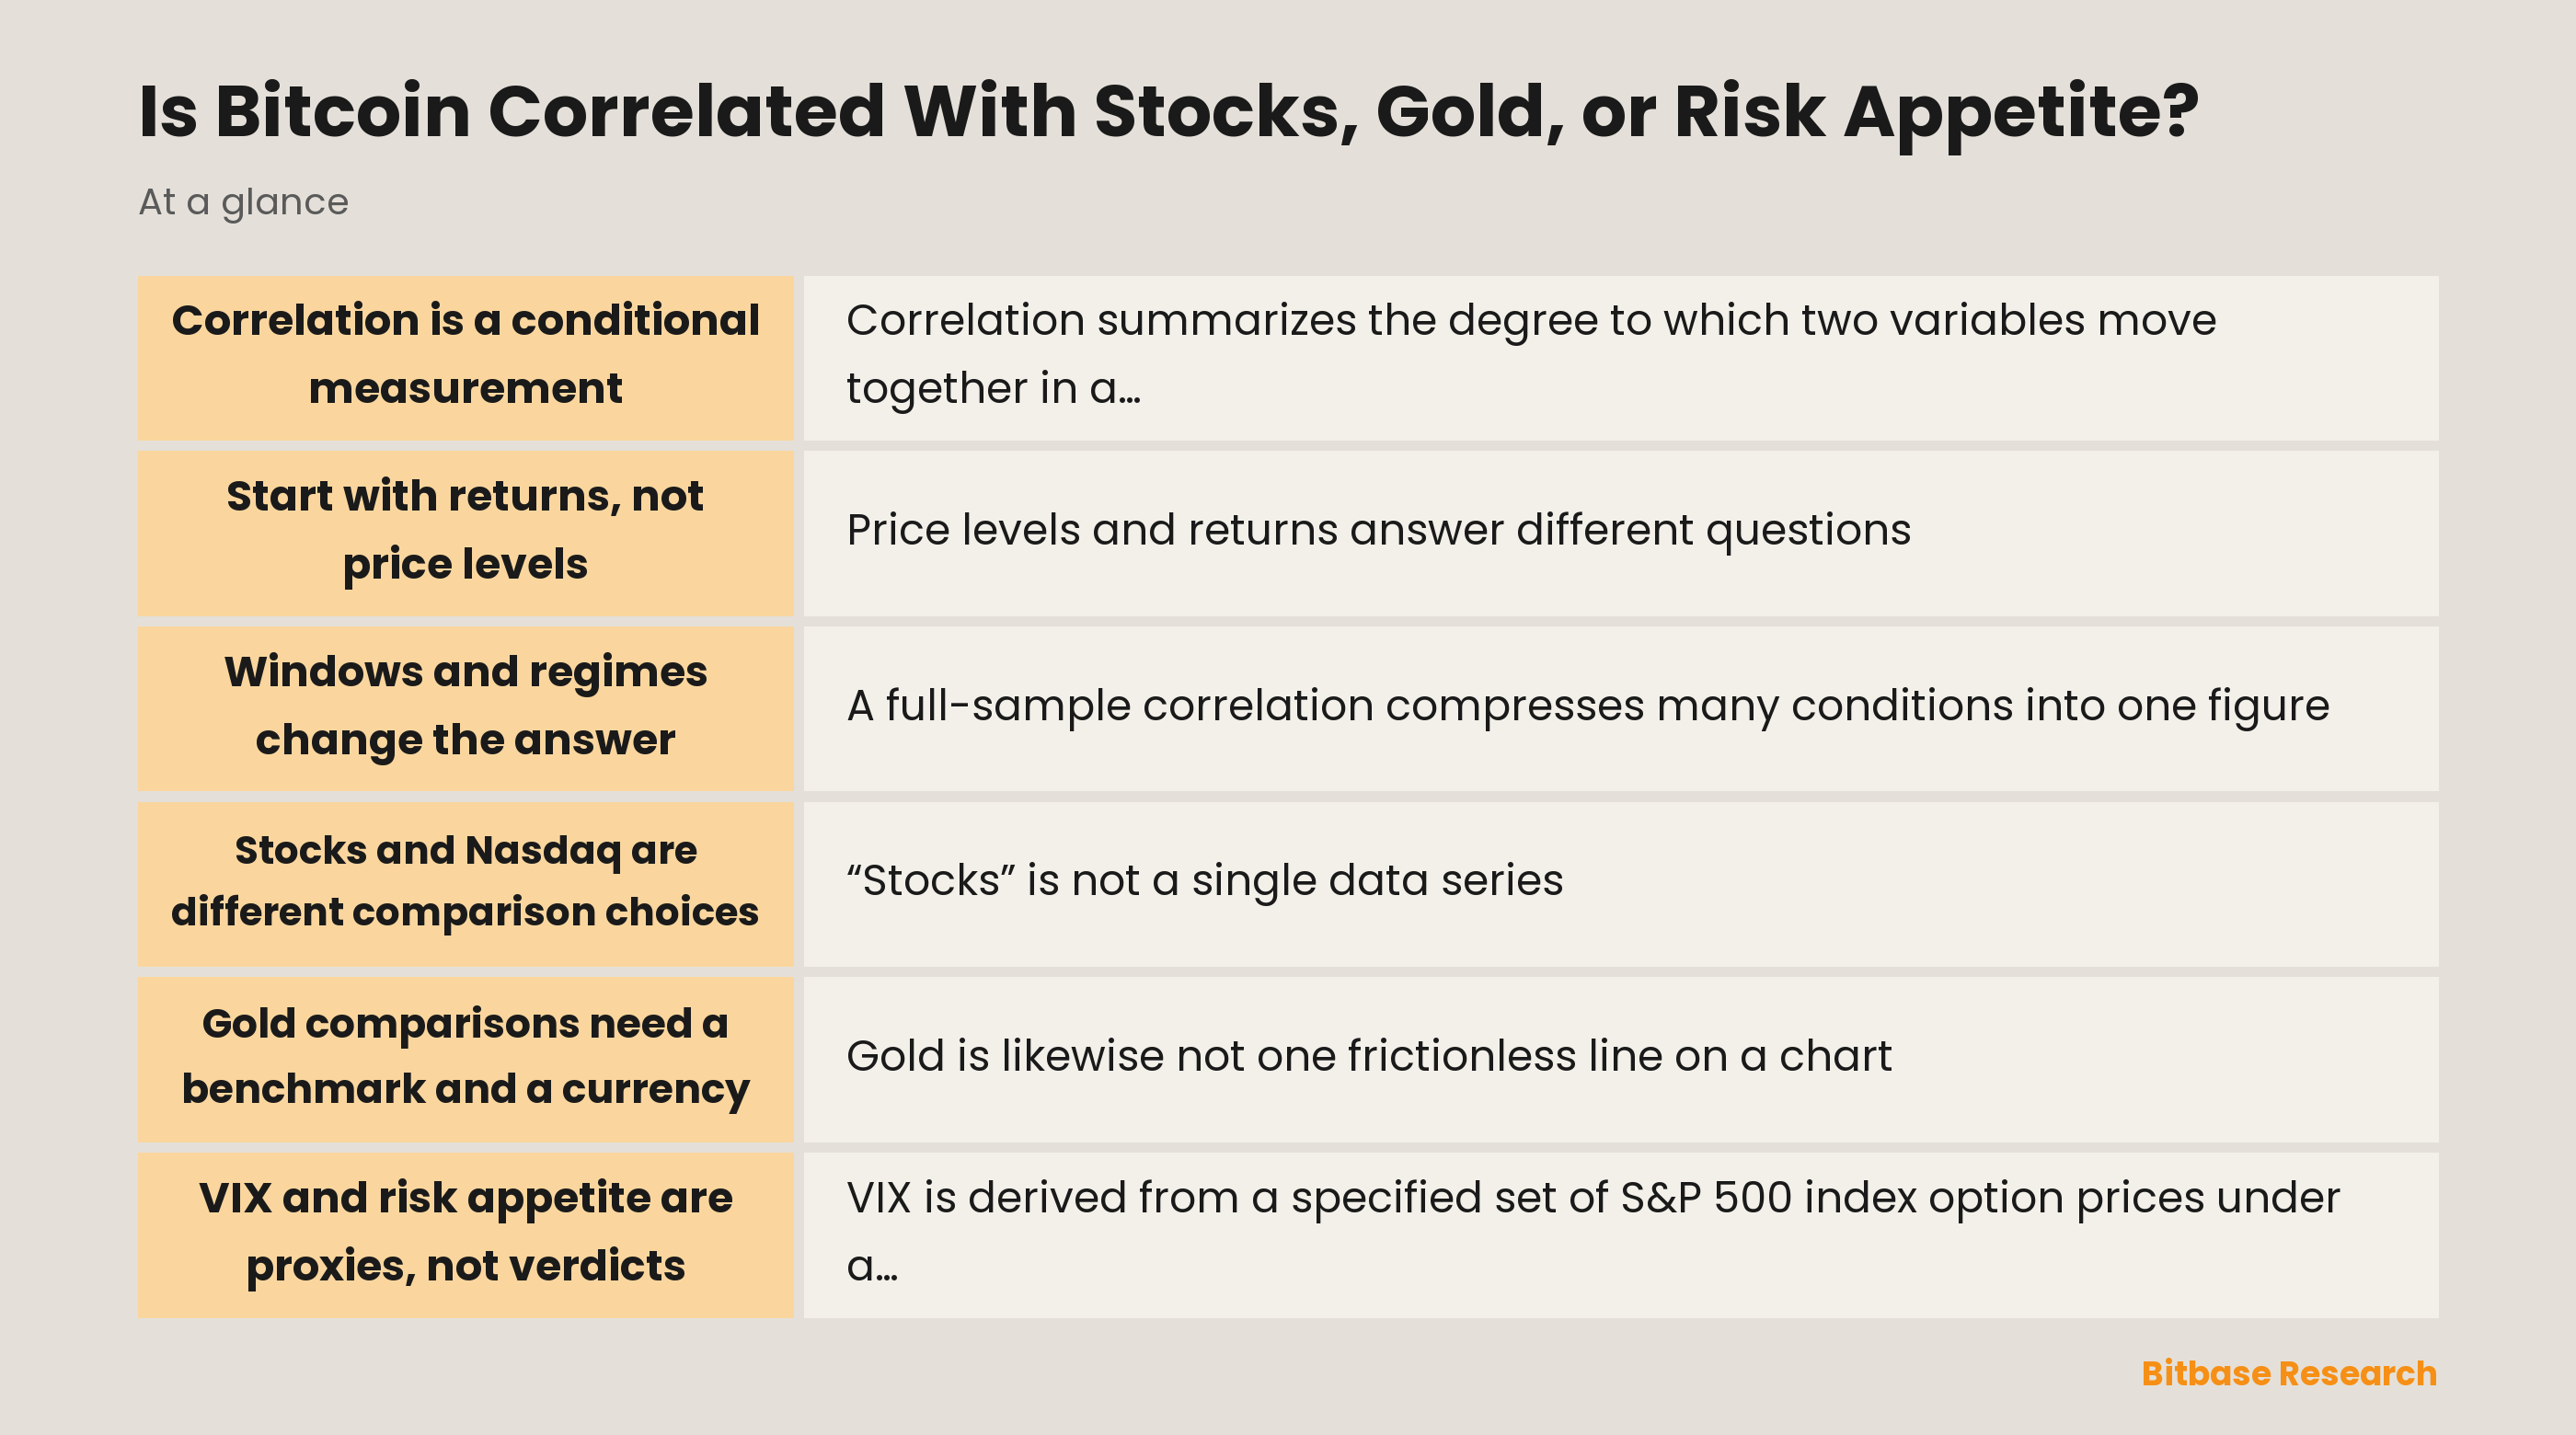
Correlation is a conditional measurement
Correlation summarizes the degree to which two variables move together in a selected dataset. The familiar Pearson coefficient captures linear co-movement after each series is measured relative to its own average in that sample. Its sign describes direction within that sample, while its magnitude describes how closely the observations fit a linear pattern. Neither feature says that one variable caused the other to move, nor does it say that the same pattern must hold after the sample ends.
The statistic is conditional because every setup makes choices. An analyst chooses an asset venue or benchmark, a quote currency, an observation frequency, a start and end point, and a way to handle dates when one market is closed. Bitcoin trades continuously, while many equity and benchmark markets follow trading calendars and defined closing times. Combining unmatched observations can change the question from simultaneous movement to movement measured at different moments.
This is why “is Bitcoin correlated?” has no complete answer by itself. The more precise question is whether Bitcoin returns had a particular linear relationship with a named comparison series, under a disclosed calculation rule, during a disclosed window. That framing keeps a coefficient in its proper role: a compact description of one sample rather than a universal property, causal mechanism, or promise about a future relationship.
Start with returns, not price levels
Price levels and returns answer different questions. A price level is the observed value of a series at a point in time. A simple return compares one observation with the prior observation, while a log return uses the logarithm of their ratio. When the question is about co-movement from one period to the next, return series are usually the more direct input because they focus on changes rather than on the accumulated path of each price.
Comparing raw levels can be misleading when both series have persistence, trend, changing scale, or long runs in one direction. Two upward-sloping paths can look closely related even when their period-by-period changes are not synchronized. A level comparison can still be meaningful for a specifically defined research question, but it should not be silently substituted for a return correlation. The chart, formula, and interpretation should all make the chosen transformation visible.
Return definition also affects the result. Daily close-to-close observations, intraday intervals, and weekly observations each aggregate information differently. A move that is visible at one frequency can be diluted, reversed, or obscured at another. The choice is not merely technical: it determines which variation the statistic treats as relevant. Consistency matters more than choosing a supposedly universal frequency, because reproducibility requires the same rule for both series.
Windows and regimes change the answer
A full-sample correlation compresses many conditions into one figure. It can be useful as a summary, yet it may hide episodes with different patterns. A rolling correlation recomputes the same statistic over successive, fixed-length windows, allowing the reported relationship to vary through time. The window length becomes part of the definition: a shorter window reacts more quickly to recent observations, while a longer window smooths them into a broader summary.
Market structure can change without any error in the calculation. Liquidity conditions, participation, macroeconomic news, policy expectations, derivatives activity, operational access, and the composition of a benchmark can all alter the setting in which prices respond. A change in the relationship is often called a structural break or regime change. It means the historical sample may contain more than one process, not that any single period was necessarily abnormal.
Outliers matter as well. Pearson correlation uses deviations from each series’ average, so unusually large observations can have substantial influence. A careful review therefore looks beyond the final coefficient to the dates, scatter of observations, and return distributions that produced it. Reporting a range of window lengths or clearly separating regimes can be more informative than selecting one interval and presenting its coefficient as a stable characteristic.
Stocks and Nasdaq are different comparison choices
“Stocks” is not a single data series. A broad equity benchmark, a large-company benchmark, a sector index, and an individual share reflect different constituent rules and weights. The phrase stock market bitcoin correlation is meaningful only after the stock measure is named and its return series is aligned with Bitcoin under the same timing and currency conventions. Without those details, a comparison may combine different economic exposures under a single label.
An equity benchmark can also be a proxy rather than a complete explanation. It may reflect corporate earnings expectations, discount-rate changes, currency conditions, sector composition, and many other inputs at once. If Bitcoin and an equity index have positive or negative co-movement in a window, several channels could be consistent with that observation. Correlation alone cannot identify which channel, if any, was responsible, and it cannot distinguish a direct connection from a common response to another variable.
The same discipline applies to nasdaq bitcoin correlation. Nasdaq-100 is a defined index with its own eligibility, construction, and maintenance methodology; it should not be treated as a synonym for every stock market. A comparison should state whether it uses the Nasdaq-100, a broader Nasdaq index, or another series, then retain that definition across the selected window. Changing the benchmark mid-analysis changes the object being measured.
Gold comparisons need a benchmark and a currency
Gold is likewise not one frictionless line on a chart. A study should state whether it uses an identified benchmark, a spot quotation, a futures series, or another instrument, and it should state the quote currency. Different forms can have different timing, settlement conventions, and sources of variation. An analysis that simply labels a series “gold” leaves those choices invisible and makes the result harder to reproduce or compare with another study.
The search phrase gold bitcoin correlation explained is best answered by separating the statistical question from narratives about what either asset “should” represent. A positive coefficient in one return window means the chosen return observations tended to share a direction there; a negative coefficient means they tended to move in opposite directions there. Neither observation establishes that Bitcoin is a substitute for gold, a hedge against another asset, or a dependable response to a particular event.
Currency selection deserves equal attention. Bitcoin quoted in one currency and gold quoted in another include different exchange-rate components, even if the underlying instruments are otherwise unchanged. Converting both to a common currency may make the comparison more coherent, but it does not remove every measurement choice. The series timestamp, benchmark source, and calendar alignment still determine which observations enter the calculation and therefore what the correlation describes.
VIX and risk appetite are proxies, not verdicts
VIX is derived from a specified set of S&P 500 index option prices under a published methodology. That makes it an option-derived measure connected to expected equity-market volatility over the methodology’s target horizon, not a direct reading of every participant’s preferences or of the entire financial system. It can be a useful contextual series when its construction and scope are acknowledged, but it is not interchangeable with an equity return, a credit spread, a funding measure, or a survey.
For the same reason, vix bitcoin correlation should be interpreted as a relationship between Bitcoin returns and changes or levels of a named volatility index under a precise design. A correlation using VIX levels asks a different question from one using changes in VIX. The usual inverse association often discussed between equity performance and implied volatility is also not a rule that can be mechanically transferred to Bitcoin. Each series has its own trading hours, information flow, and market structure.
Risk appetite is broader than any one indicator. The phrase risk on risk off crypto explained can describe a narrative in which participants collectively prefer or avoid perceived risk, but the narrative still needs observable proxies. Equity returns, volatility measures, credit spreads, currencies, and funding conditions can each be candidates, yet they measure different dimensions. Using several disclosed proxies can test whether a proposed common environment is robust; using one proxy cannot settle the meaning of the label.
A transparent way to report results
A transparent correlation study begins with a short methods statement. It names the Bitcoin price source, the comparison benchmark, the quote currency, the observation time, the frequency, the return formula, the sample window, and the treatment of missing or non-overlapping observations. It then labels whether the result is full-sample or rolling. These details make it possible for another reader to understand the scope of the finding and to reproduce or challenge it without guessing at hidden choices.
The reported coefficient should be accompanied by context. A scatter plot can show whether a few observations dominate the relationship. A rolling chart can show whether the full-sample number conceals different intervals. A comparison using alternative reasonable alignment rules can reveal sensitivity to market hours. These checks do not eliminate uncertainty, but they help separate a robust description of the selected data from an impression created by a single chart, window, or transformed series.
The clearest conclusion is usually conditional and modest. Bitcoin can have varying measured relationships with named stock, gold, and volatility series because correlation depends on construction, time, and regime. Common drivers may be plausible hypotheses, but they require evidence beyond a coefficient. Treating the statistic as a conditional measurement preserves the useful information it contains while avoiding the unsupported claim that Bitcoin permanently belongs to one market category or must respond in one fixed way.
Disclaimer: This article is educational content from Bitbase Academy, provided for information only. It does not constitute investment, trading, tax, or financial advice. Crypto assets are volatile; assess your own risk. Written as of August 2026; refer to the latest official information.
References
[1] Pearson: correlation-methodology publication royalsocietypublishing.org
[2] Granger and Newbold: spurious regressions doi.org
[3] S&P Dow Jones Indices: U.S. Indices Methodology spglobal.com
[4] Nasdaq: Nasdaq-100 Index Methodology nasdaqomx.com
[5] LBMA: Gold Price methodology and FAQs lbma.org.uk
[6] Cboe: Volatility Index Methodology cboe.com