Crypto-options dashboards can compress a great deal of information into a few curves and ratios. Someone searching “options skew crypto explained” is usually trying to understand why implied volatility differs across options, while a search for “put call ratio crypto” often asks what the market’s put and call counts represent. Both questions are useful, but neither metric is a ready-made forecast. Each is a description built from a particular set of contracts, valuation conventions, timestamps, and data filters. Reading them responsibly starts with identifying exactly what was measured.
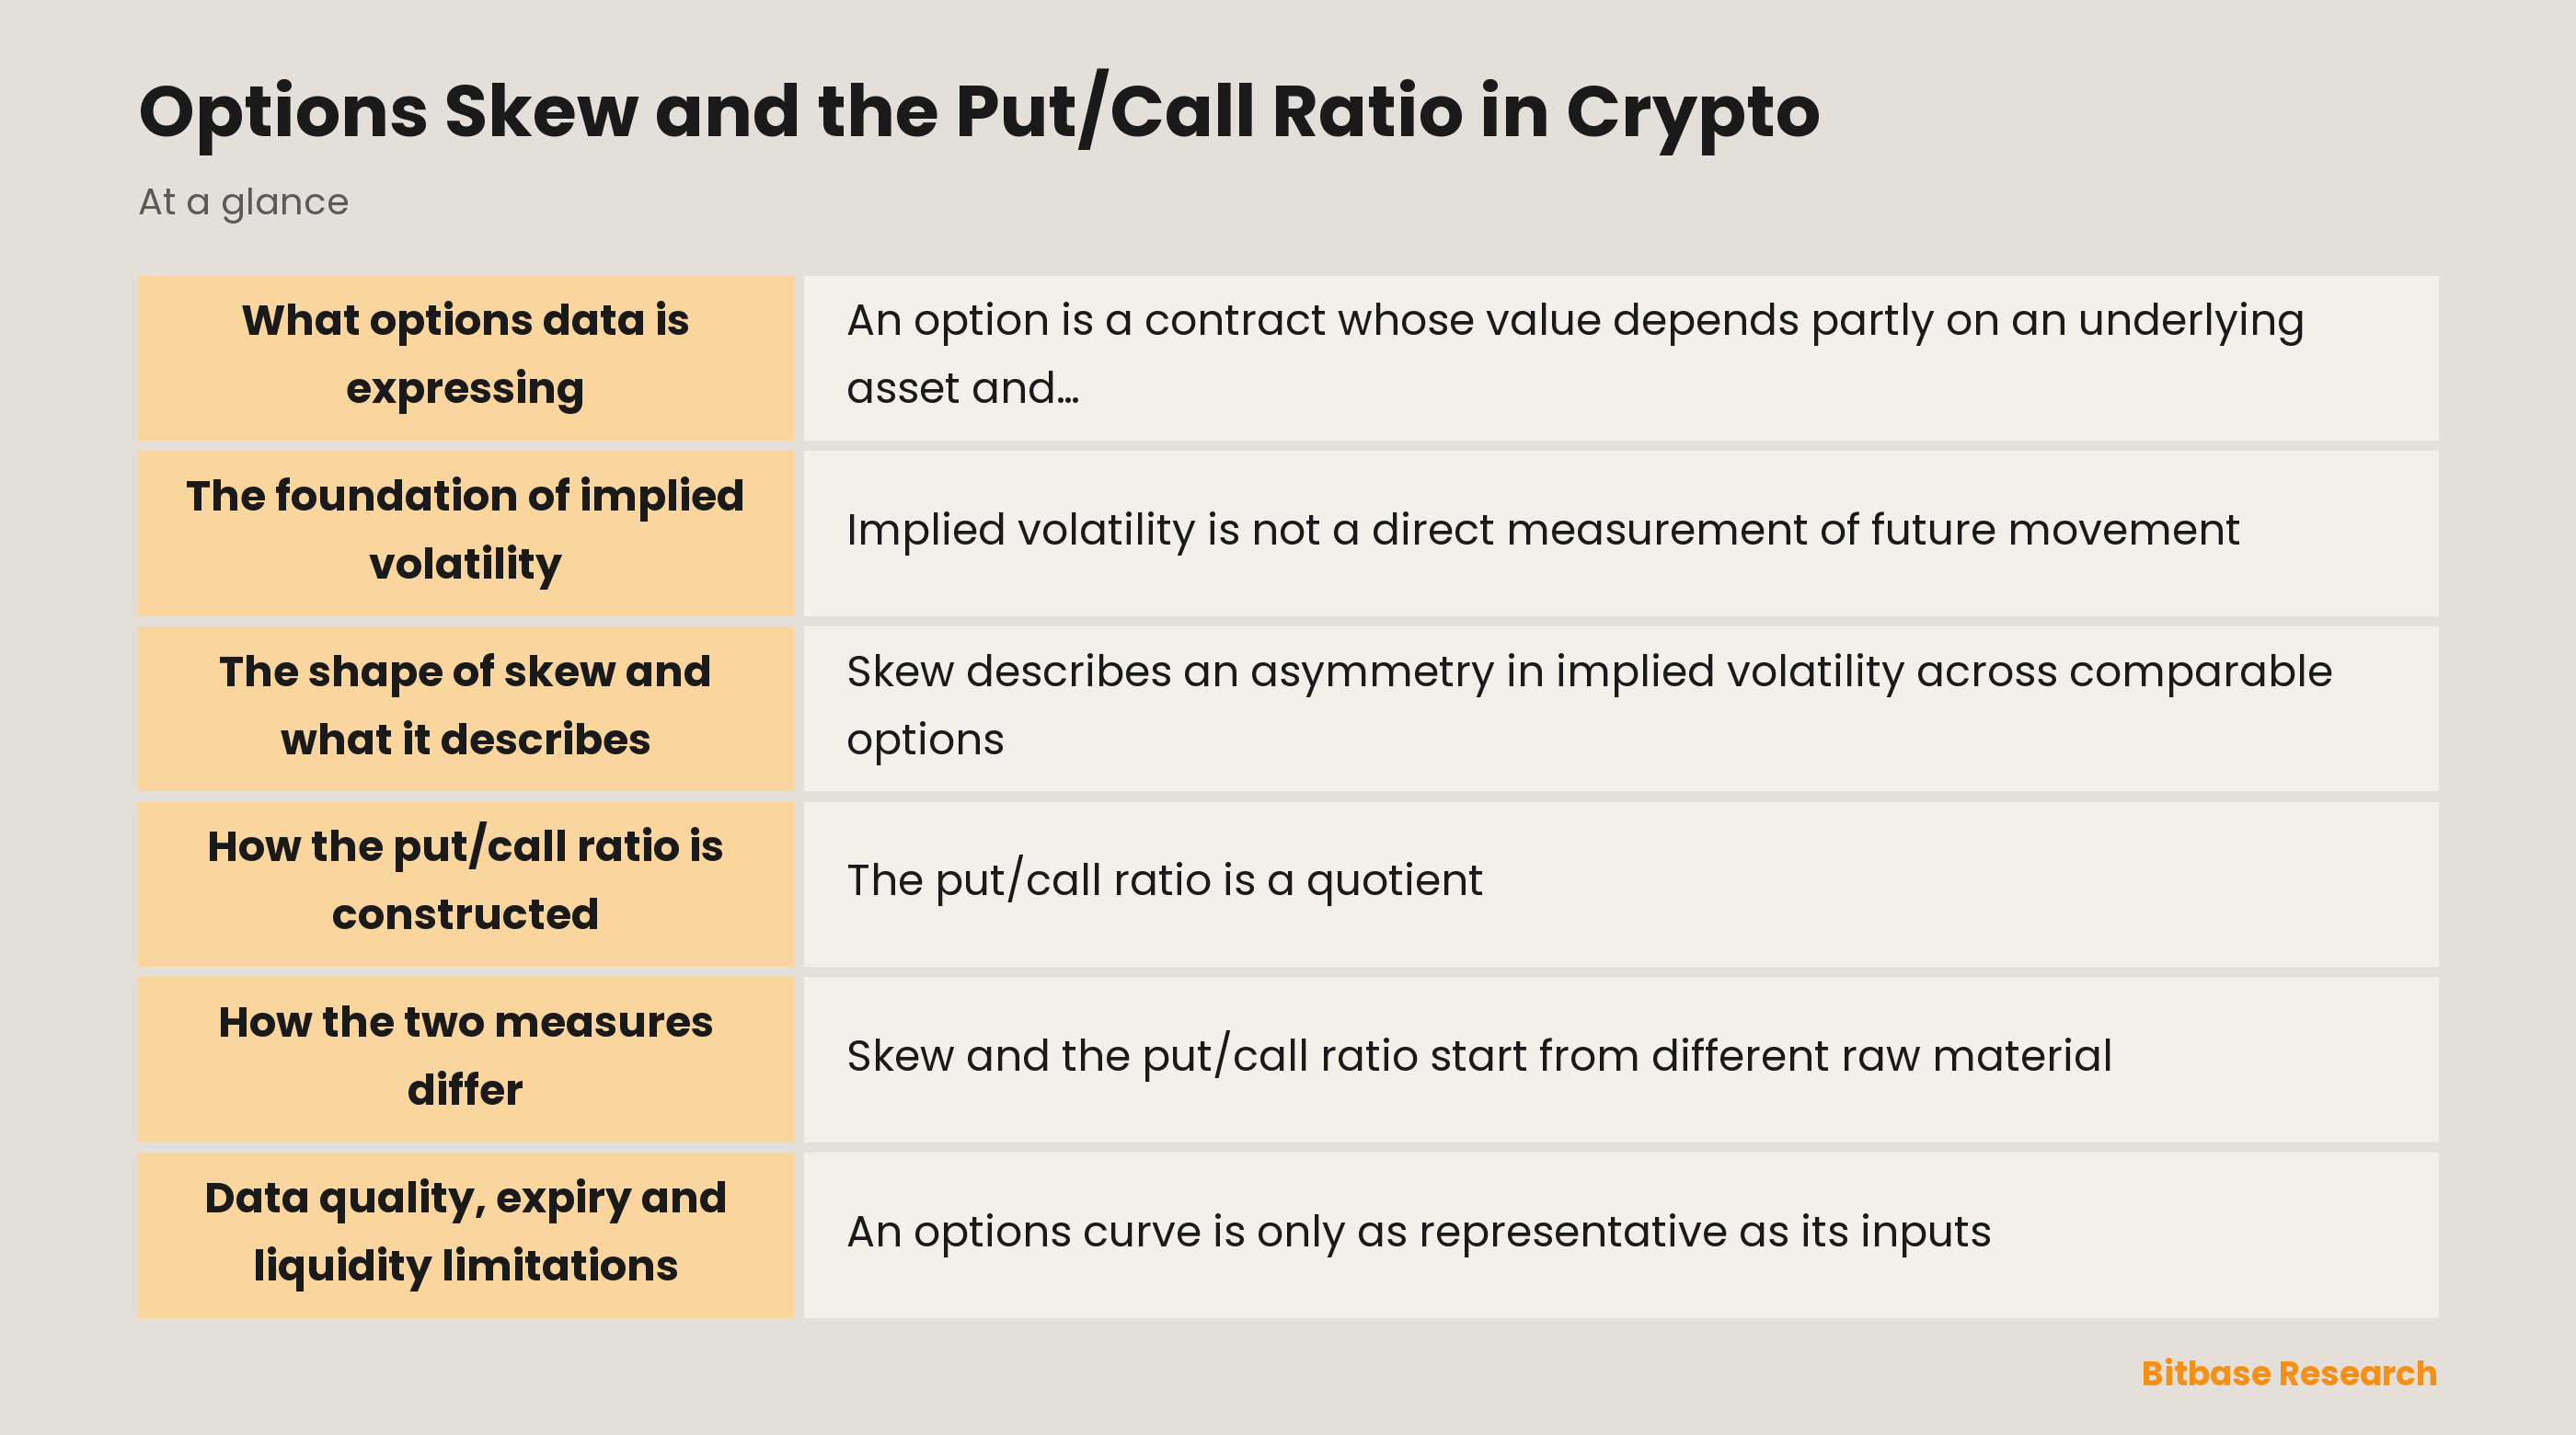
What options data is expressing
An option is a contract whose value depends partly on an underlying asset and partly on contract terms such as the strike and the expiry. A call and a put have different payoff directions, but a displayed options dataset does not reveal a single shared intention behind every contract. A contract may be connected to risk management, market making, a spread, a closing transaction, an institutional mandate, or a recordkeeping event. Therefore, aggregated options data is best treated as a map of quoted prices, trades, or outstanding contracts under a stated methodology.
Crypto adds practical variation to that map. Contract specifications, settlement conventions, reference prices, quote currencies, expiry schedules, and reporting fields can differ between venues and datasets. Even labels that look familiar may be calculated differently. Before comparing a curve or a ratio, it helps to keep the underlying asset, contract type, option style, expiry range, timestamp, currency convention, and aggregation rule in view. Without those details, a clean-looking chart can combine observations that are not economically equivalent.
The foundation of implied volatility
Implied volatility is not a direct measurement of future movement. It is a model-derived input: the volatility value that, under a chosen pricing framework and the other stated assumptions, matches an observed option price. That translation lets market participants compare the time value embedded in options with different strikes and expiries more easily than they could by comparing premiums alone. An implied-volatility figure is therefore conditional on the option price, the model, the underlying reference, the time remaining, and other inputs used by the calculation.
The set of those values across strikes and maturities is often called an IV surface. One slice holds an expiry fixed and traces implied volatility over strikes, moneyness, or delta. Another slice holds a comparable strike relationship fixed and follows expiries. The surface is a compact description of relative option pricing at a point in time, not a promise about realized volatility. Its appearance can change when quotes move, when the underlying reference changes, when time passes, or when the calculation uses a different convention.
The shape of skew and what it describes
Skew describes an asymmetry in implied volatility across comparable options. For a single expiry, a chart may show lower, higher, or uneven implied volatility as strikes move away from at-the-money. The overall curve is often called a volatility smile or smirk, while skew can refer more narrowly to the relative slope or to a specific comparison between an upside option and a downside option with comparable delta or moneyness. The label is useful only when its precise construction is stated.
In crypto options, a put wing can be quoted at a different implied volatility from a call wing, and either side can change relative to the other. That difference may reflect the prices at which participants are willing to transact for particular contract exposures, as well as inventory, hedging, settlement, and liquidity conditions. It does not prove a common directional belief, a probability forecast, or a coming move. Sign conventions also vary: one data provider may calculate call IV minus put IV, while another reverses the order. A skew number needs its formula, expiry, delta or moneyness definition, and timestamp beside it.
How the put/call ratio is constructed
The put/call ratio is a quotient, not a universal market fact. In its simplest volume form, the numerator is the number of puts traded during a chosen window and the denominator is the number of calls traded during the same window. Another version uses open interest, meaning contracts still open under the dataset’s definition, rather than new trading activity. Some providers can also weight contracts by notional, premium, delta, or another measure. Those versions can answer related but different questions, so their numbers should not be compared as if they were interchangeable.
The word “crypto” does not supply the missing denominator details. A put/call ratio may cover one underlying asset or several, one expiry or all listed expiries, a narrow interval or a full day, a single venue or a composite, and trade volume or open interest. It can include only standard options or a broader set of instruments, depending on the publisher. The clearest description names the numerator, denominator, unit, contract universe, time window, venue coverage, and whether cancelled, corrected, or block records are handled in a particular way.
How the two measures differ
Skew and the put/call ratio start from different raw material. Skew is derived from option prices after a model translates those prices into implied volatility. It compares relative pricing across carefully selected strikes or deltas, normally within a defined expiry. A put/call ratio starts from counts, sizes, or open contracts and divides one category by another. It may contain no information about the implied volatility assigned to any individual option. A high ratio of one kind does not mechanically require a particular skew shape, and a pronounced skew does not require a particular ratio.
Their time behavior also differs. A skew snapshot can move with a change in quotes even when no trade appears in the reported window, especially if a methodology uses marks or executable bid and ask data. A volume ratio changes only when qualifying trades are recorded, while an open-interest ratio is affected by opening, closing, exercise, expiry, and data-processing conventions. Comparing the two can still help frame questions about the composition and pricing of a specific options sample, but it cannot determine the reasons behind that sample without more information.
Data quality, expiry and liquidity limitations
An options curve is only as representative as its inputs. A stale quote, a wide bid-ask spread, a small transaction, a missing wing, or a model input carried forward from an earlier time can distort a plotted implied volatility. Sparse strikes may force interpolation, and different providers can choose different filters, smoothing methods, reference prices, and delta conventions. An apparently smooth surface can be a calculated approximation rather than a continuous set of independently traded prices. These are measurement limits, not evidence that one interpretation is correct.
Expiry changes what is being compared. A short-dated option and a longer-dated option embed different time horizons, and their skew may react differently to scheduled events, settlement mechanics, or the passage of time. The put/call ratio has a parallel issue: pooling all expiries can hide whether the activity came from contracts near expiry or further out. Liquidity matters as well, because a single active or illiquid series can exert an outsized effect in a narrow dataset. Any summary should preserve the expiry bucket and the quality controls used to form it.
Indicators are not directional signals
Neither metric converts cleanly into a market direction signal. Puts can be associated with many structures and risk-management purposes, while calls can be paired with other contracts or offset elsewhere. Open interest does not identify whether a position was initiated, closed, transferred, or economically neutralized. Likewise, a skew describes relative implied-volatility pricing under a convention; it does not state the probability, timing, or size of a future movement. An indicator can be informative about its own construction without explaining the motives or net exposure behind every included contract.
A careful reading is consequently procedural rather than predictive. State the date and timestamp, underlying, expiry range, option selection rule, price source, model convention, ratio numerator and denominator, and the presence of low-liquidity observations. Then separate what the dataset actually records from broader claims about sentiment or direction. This approach makes the metrics easier to audit and compare, while keeping their uncertainty visible. It is educational market mechanics, not a substitute for independent risk assessment or professional advice.
Disclaimer: This article is educational content from Bitbase Academy, provided for information only. It does not constitute investment, trading, tax, or financial advice. Crypto assets are volatile; assess your own risk. Written as of August 2026; refer to the latest official information.
References
[1] Deribit Insights: Option Pricing & Delta Hedging in a non-Black-Scholes World Pt. 1 insights.deribit.com
[2] CME Group: Introduction to CVOL Skew www.cmegroup.com
[3] Cboe: How Early Exercise Order Flow Impacts Equity Option Put/Call Ratios www.cboe.com
[4] The Options Clearing Corporation: Characteristics and Risks of Standardized Options www.theocc.com