Social data can describe attention, language, participation and search behavior, but none of those observations is automatically a price forecast. A post count, a sentiment score or a search index only becomes a testable signal after its population, timestamp, transformation, target and evaluation rule are stated. This article explains social engagement vs price crypto, token mentions vs price, crypto sentiment divergence, social volume vs trading volume, search trends crypto indicator design and the limits of a google trends bitcoin indicator. It does not make a price prediction, give a trading rule or rank any asset.
What does “predict price” actually mean?
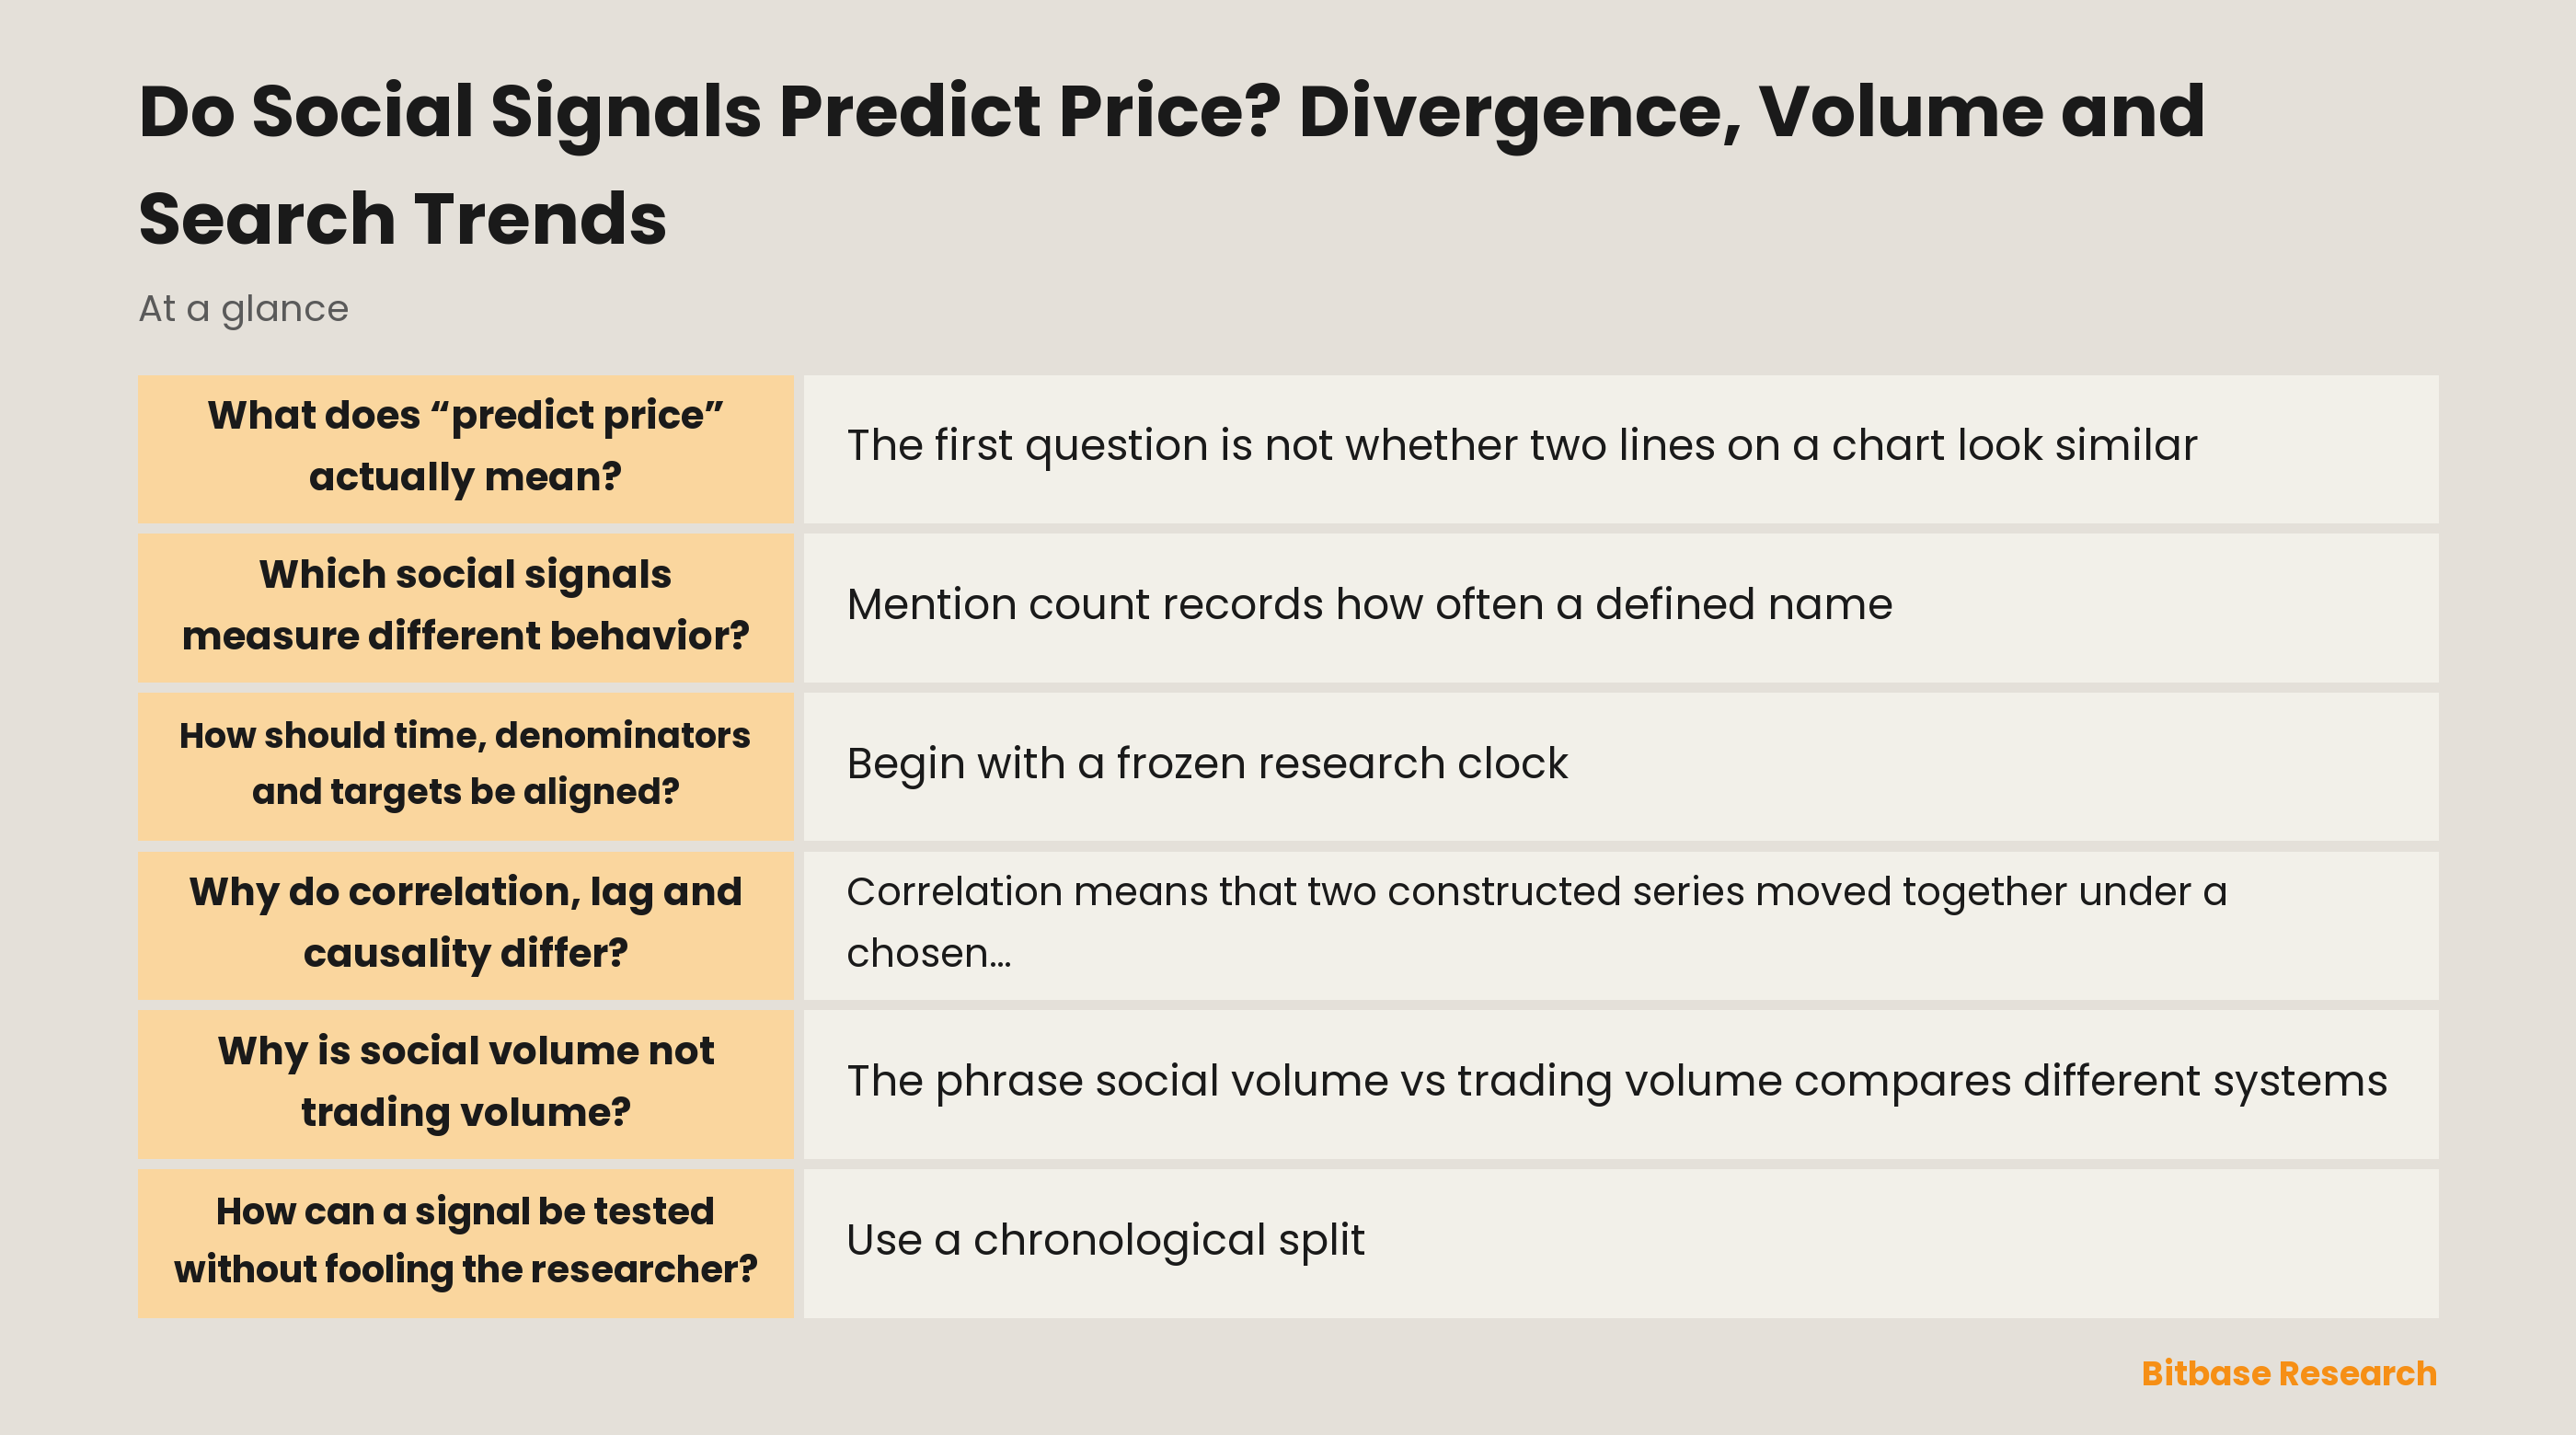
The first question is not whether two lines on a chart look similar. It is what outcome is being predicted and when the prediction would have been available. A study might target the next interval’s return, the sign of a move, realized volatility, trading activity, a price level or a large-move label. Those are different targets, with different base rates and different ways for a model to appear useful by chance.
Prediction also has a time boundary. A social post timestamp may mean creation time, collection time, the first time a crawler saw it, or a later edit or repost. A market timestamp may be a trade, an aggregated bar close or a venue-specific reference. If a score includes posts that arrived after the target interval began, it contains future information. A visually persuasive chart can therefore be invalid even before any statistical test is run.
The phrase social engagement vs price crypto should be read as a hypothesis to audit, not as a promised relationship. A responsible result says which feature was observed, which market outcome followed, how long the gap was, what data were unavailable, and whether the result survived a separate test period. It also reports failure cases. A single fitted relationship cannot establish that social behavior caused a later price movement.
Which social signals measure different behavior?
Mention count records how often a defined name, ticker or topic appears in a stated corpus. It can rise because more people are talking, because a message is copied, because an unrelated word shares the same spelling, or because automated accounts repeat it. Token mentions vs price is therefore not a comparison between a pure attention measure and a pure market measure. It is a comparison between two constructed series whose entity-matching and filtering rules matter.
Engagement measures reactions, replies, reposts, views or other interactions. They are not interchangeable with mention count: a small number of posts can attract much interaction, and a high count can consist of low-attention duplicates. Sentiment scores add another modelling layer. A classifier may treat a technical announcement, irony, slang, a quotation or multilingual text differently from a human reader. Its output is an estimated label distribution, not a direct observation of belief.
Search interest measures a different behavior again: people entering a query into a search engine. A search trends crypto indicator must specify the query or Topic, language, geography, category and time range. Google Trends describes its numbers as sampled, normalized and relative rather than absolute search counts. The distinction between a literal term and a broader Topic can change the series before a forecast model has done any work.
How should time, denominators and targets be aligned?
Begin with a frozen research clock. Define one timezone, one observation frequency and a publication-delay rule for every source. For example, a daily feature may include only content demonstrably available before a specified cutoff, while the target begins after that cutoff. The design must say how deleted posts, edited content, reshares, missing intervals and venue outages are handled. Without that record, another researcher cannot tell whether timing created the apparent lead.
Denominators are just as important as raw totals. A rise in mentions can reflect growth in all platform activity, a change in the number of tracked accounts or a shift in collection coverage. Engagement can be divided by eligible posts, estimated audience, active accounts or another declared denominator; each answers a different question. A Google Trends value is already normalized within its query context, so it should not be treated as a count of new users or a comparable absolute volume across arbitrary exports.
The market target needs the same discipline. “Price” should name a price type, source, frequency, currency convention and treatment of illiquid intervals. Returns should state their horizon and transformation. If a study tests many assets, signal definitions, lags and targets, it should record the full search space instead of presenting only the strongest result. Repeated selection creates a multiple-testing problem even when each individual chart looks clean.
Why do correlation, lag and causality differ?
Correlation means that two constructed series moved together under a chosen transformation and sample. It does not reveal which moved first, whether either changed the other, or whether a third event changed both. News, broad market movement, listing events, outages, policy changes or a change in platform visibility can simultaneously alter discussion and market activity. Removing neither of those possibilities requires more than a correlation coefficient.
Lag analysis asks whether earlier values of one series improve a specified model of a later value of another series. It can be useful, but the result depends on frequency, lag length, stationarity choices, missing-data treatment and the benchmark model. A signal that seems early at one interval may be simultaneous or late at another. The finding must be checked in an untouched period rather than only in the period used to choose the lag.
Structural causality makes a still stronger claim: what would have happened under a different intervention while relevant alternative explanations were held fixed. Observational social and market data rarely provide that counterfactual by themselves. Research has reported different relationships depending on sample and method, including evidence of information transfer in both directions and studies reporting no Granger causality from social sentiment to returns. That disagreement is a reason to document design choices, not to select the preferred conclusion.
Why is social volume not trading volume?
The phrase social volume vs trading volume compares different systems. Social volume may be the number of posts, unique authors, messages after deduplication or interactions in a selected corpus. Trading volume may be venue-reported activity, aggregated activity under a vendor’s rules, or another market statistic. Each can be revised, incomplete or shaped by its own incentives. Neither is a direct measure of the other.
They can move together after a common event, yet still have no stable leading relationship. A sharp market move can prompt discussion and searching; a widely shared announcement can prompt both market attention and content creation; and platform amplification can raise social counts without a comparable change in market participation. Treating a same-day correlation as a leading signal silently chooses a causal story that the data have not demonstrated.
Crypto sentiment divergence describes a difference between a sentiment series and another chosen series, such as returns, volume or attention. It is not a universal event type. Its sign depends on the classifier, aggregation rule, baseline, time window and comparison variable. A divergence label should therefore include its formula and uncertainty, and it should not be translated into an automatic bullish or bearish conclusion.
How can a signal be tested without fooling the researcher?
Use a chronological split, not a random shuffle of time rows. Fit entity rules, sentiment models, thresholds and feature transformations on an earlier development window; freeze them; then evaluate on a later holdout window that did not guide the choices. A rolling or walk-forward design can show whether performance is stable as the environment changes. The report should identify every revision made after a poor result.
Compare the proposed signal against simple baselines that would have been available at the same time. Depending on the stated task, a baseline might be a previous value, an unconditional rate, a market-only model or a no-change rule. Report more than one evaluation view where appropriate: directional accuracy, calibration, error, coverage, turnover assumptions and sensitivity to the observation frequency. A claimed improvement in one metric may disappear in another.
Finally, test negative controls and fragile assumptions. Swap in irrelevant terms, shift timestamps, remove high-activity accounts, change the language mix, vary the deduplication rule and repeat the analysis across non-overlapping periods. If the result appears only after one convenient filter or one market regime, the honest finding is limited evidence. That is more informative than disguising an unstable pattern as a general forecast.
What can a careful conclusion say?
Social data can be useful descriptive evidence about attention, conversation and search behavior. It may help a researcher identify when a corpus changed, when a topic was amplified or when a measurement deserves closer inspection. It cannot, by itself, tell a reader why a market moved or what it will do next. The same post can be reaction, coordination, spam, reporting or discussion; the raw count does not settle which one it is.
The strongest conclusion is conditional: under stated sources, filters, timestamps, targets and a specified evaluation design, a feature may or may not add information beyond a chosen baseline. That conclusion belongs to the tested sample and should carry its uncertainty, revisions and failure cases. It should not be restated as an evergreen forecast when platform rules, model performance and market conditions can change.
So, do social signals predict price? Evidence is limited, heterogeneous and sensitive to design. Social engagement, mentions, sentiment, social volume, trading volume and search interest are different measurements, not interchangeable votes about value. A careful analysis records the construction of each series, tests time order and baselines, separates association from causal claims, and stops before turning an uncertain measurement into a price call or an action recommendation.
Disclaimer: This article is educational content from Bitbase Academy, provided for information only. It does not constitute investment, trading, tax, or financial advice. Crypto assets are volatile; assess your own risk. Written as of August 2026; refer to the latest official information.
References
[1] Google Trends: FAQ about Google Trends data support.google.com
[2] Google Trends: Compare search terms and topics support.google.com
[3] Social Media Sentiment Analysis for Cryptocurrency Market Prediction arxiv.org
[4] Forecasting Cryptocurrencies Log-Returns: a LASSO-VAR and Sentiment Approach arxiv.org
[5] Information-theoretic measures for non-linear causality detection arxiv.org