
Macro comparisons involving Bitcoin become more useful when the labels are separated before the chart is interpreted. A dollar index, a nominal Treasury yield, a real yield, inflation compensation, a term premium, and broad risk appetite describe different measurements with different construction rules. They can move together in a chosen sample, but that observation is conditional evidence—not a forecast, a stable law, or a reason to buy, sell, hold, hedge, or trade any asset.
What does each macro measure actually capture?
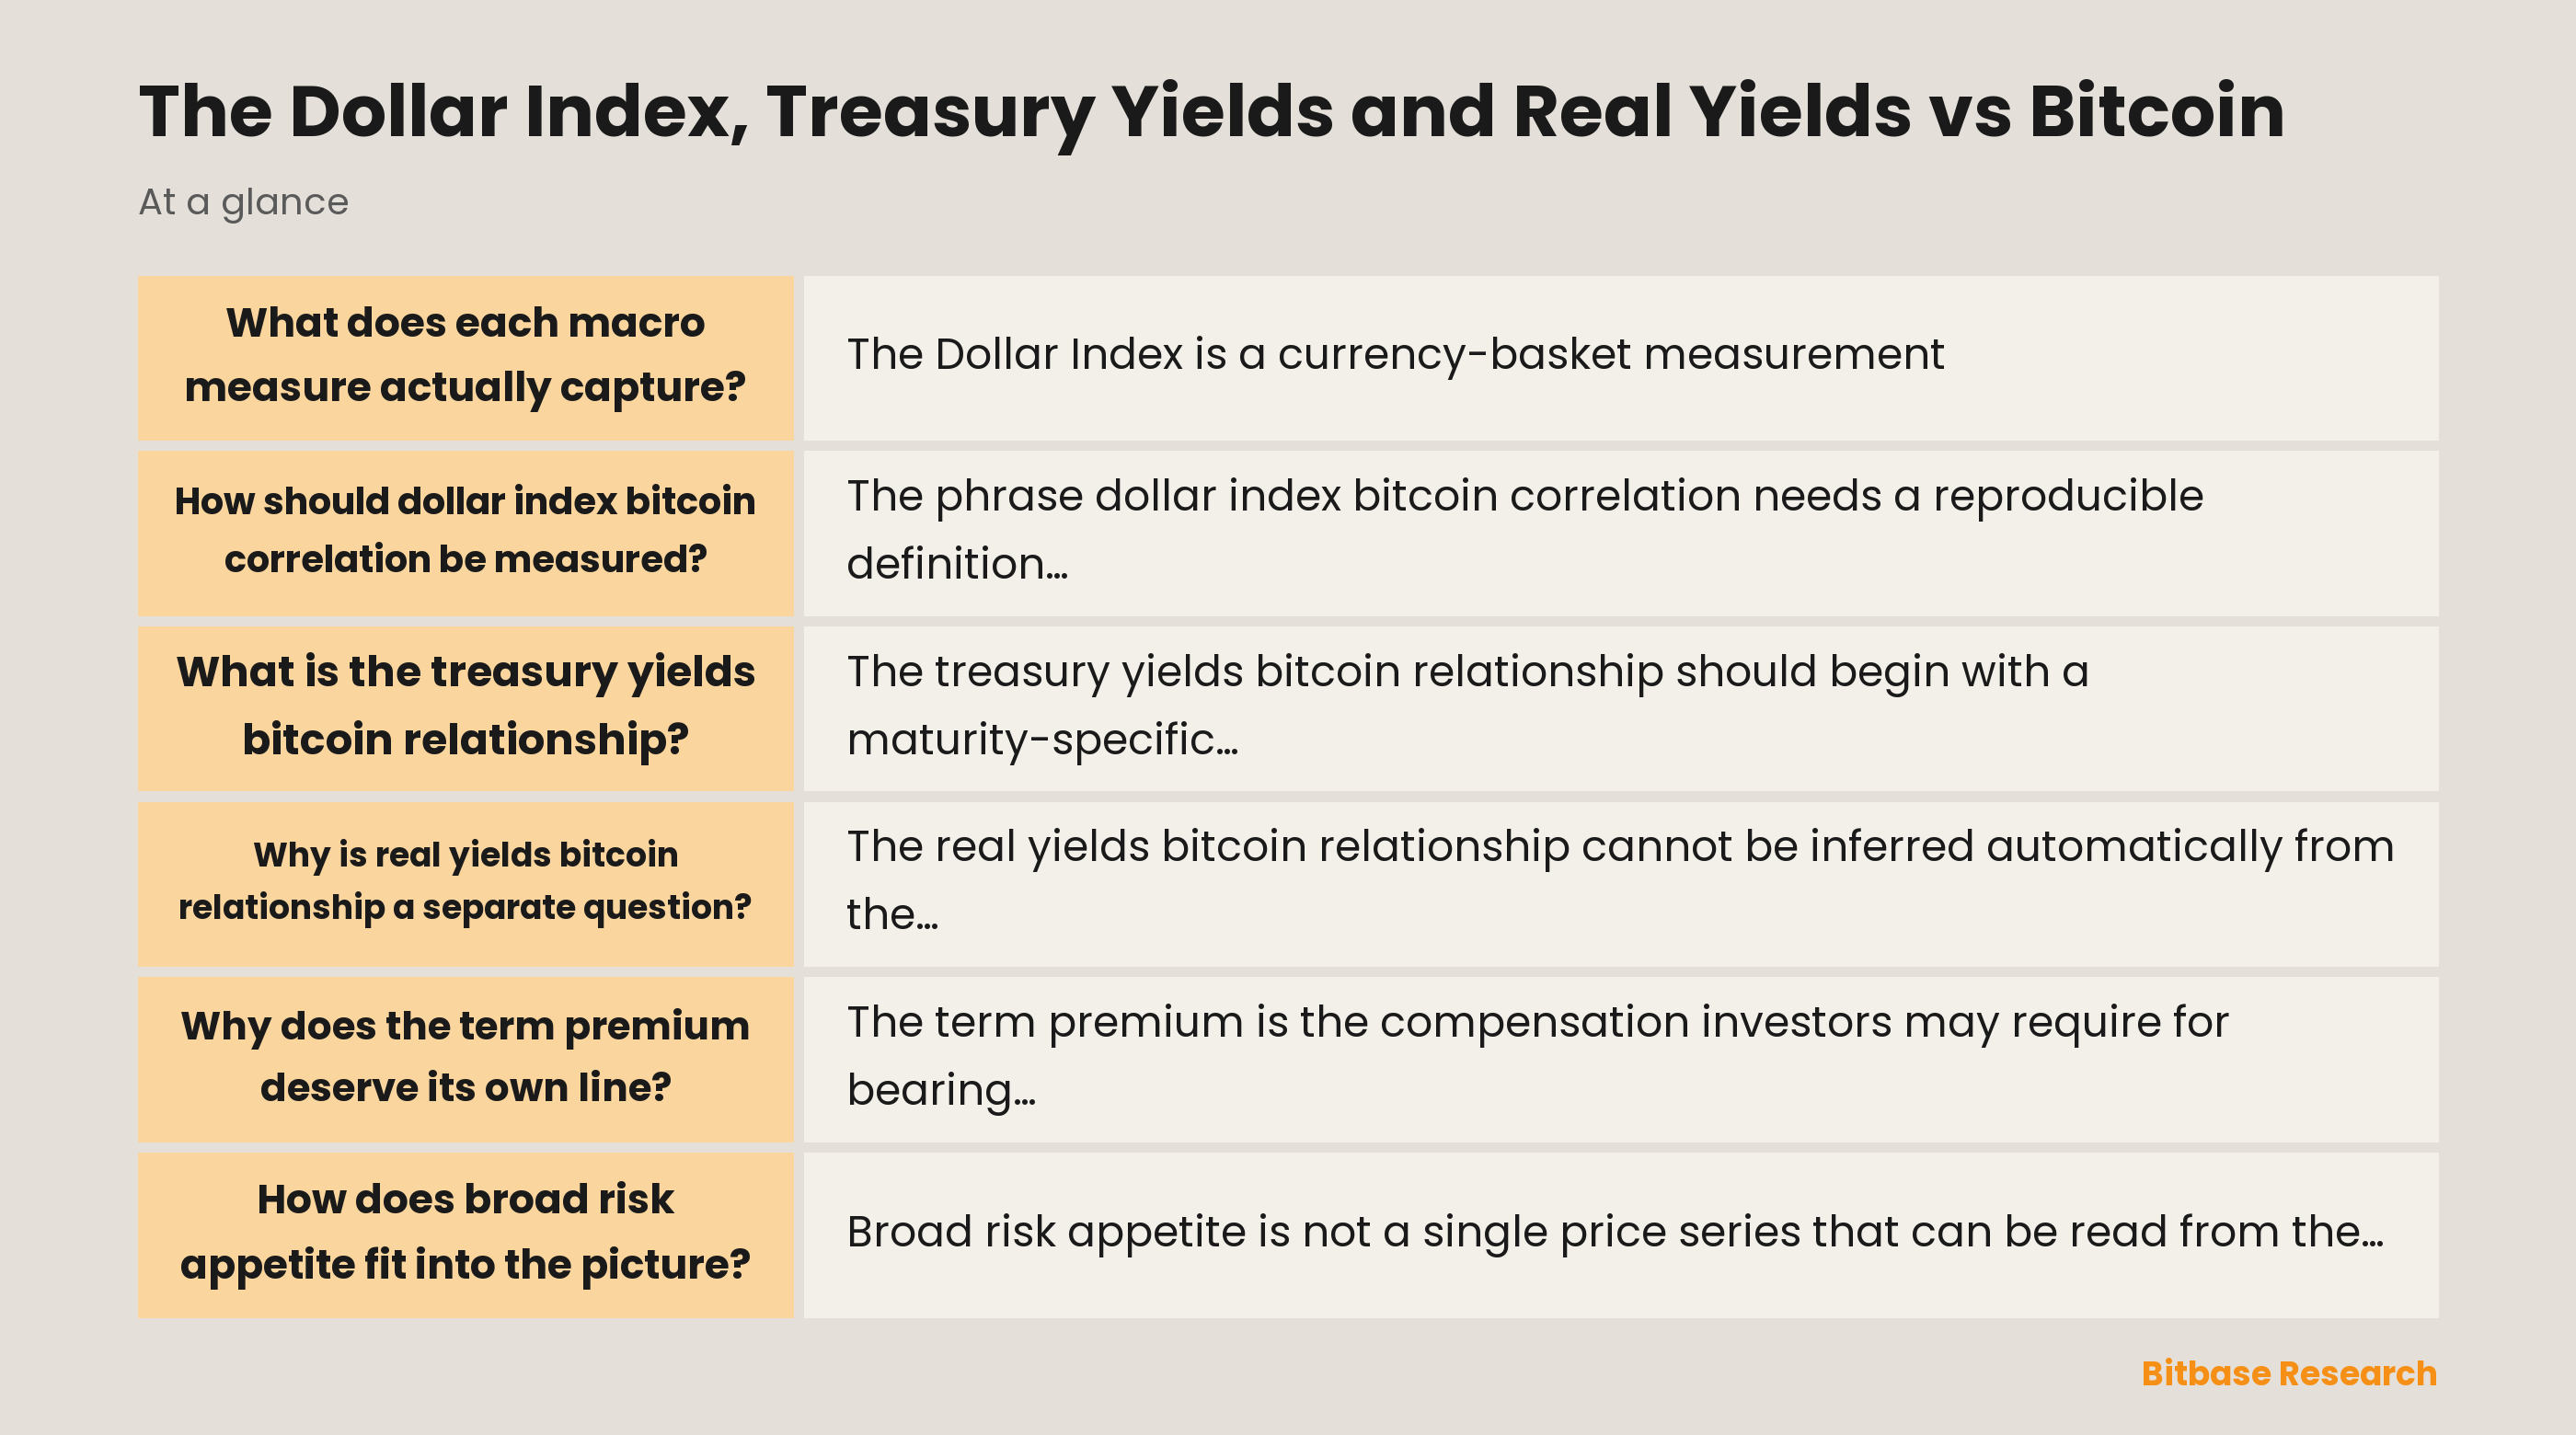
The Dollar Index is a currency-basket measurement, not a complete measure of the dollar or of global liquidity. For example, a particular dollar index may use fixed currency constituents and weights, then summarize their exchange-rate moves against the U.S. dollar. Its reading therefore depends on that basket, the index methodology, the quotation convention, and the observation time. A move in such an index says something specific about the dollar relative to its defined peers; it does not independently identify a monetary-policy surprise, a funding condition, or a worldwide change in risk appetite.
A nominal Treasury yield is a market-implied return measure for a stated maturity and instrument or curve methodology. It must be labeled by maturity, source, and time convention because a short maturity, an intermediate maturity, and a long maturity can move for different reasons. A published par curve is also an estimated curve drawn from market inputs, while an individual security may have its own liquidity and cash-flow features. Calling all of those observations simply “rates” hides the measurement choice that precedes any comparison with Bitcoin.
A real yield is a separate measurement, commonly associated with inflation-protected Treasury securities or a fitted real-yield curve. It is not merely a nominal yield with a single inflation number subtracted in every dataset. Instrument design, curve fitting, market liquidity, and maturity matching affect what is observed. The gap between nominal and real yields is often described as inflation compensation, but that gap can include compensation for inflation risk and liquidity conditions as well as views about future inflation. These distinctions matter before any cross-asset relationship is described.
How should dollar index bitcoin correlation be measured?
The phrase dollar index bitcoin correlation needs a reproducible definition before it can carry analytical weight. A reader should specify the exact dollar index, the Bitcoin price source and currency, the time zone used to align closes, the sampling frequency, and whether the calculation uses price levels, log levels, returns, or percentage changes. It should also state the sample window and the handling of missing observations. A correlation calculated from mismatched timestamps or different transformations may describe a data-construction choice more than a market relationship.
Correlation is a summary of co-movement in a selected sample, not evidence that either series caused the other to move. A dollar index can react to changes in its constituent currencies, relative growth expectations, policy expectations, trade developments, or event-specific demand for a currency. Bitcoin can simultaneously be affected by its own market structure, liquidity, leverage, custody flows, protocol events, and participation conditions. When two series move in opposite directions, the shared driver may be broad risk repricing; when they move together, the explanation may instead lie in a different mix of shocks or in the selected dates.
Conditional analysis is more disciplined than a single headline coefficient. Compare the relationship across stated horizons, calendar windows, and volatility environments, while keeping the measurement convention unchanged. Note when the sign or magnitude differs, and avoid averaging those differences into a claim of a permanent inverse or positive link. The Dollar Index has a narrow currency-basket scope, so it cannot stand in for all currency effects, all funding conditions, or the full macro environment faced by Bitcoin market participants.
What is the treasury yields bitcoin relationship?
The treasury yields bitcoin relationship should begin with a maturity-specific nominal yield rather than a generic “yield” line. Nominal Treasury yields can be understood conceptually as reflecting expectations for future short-term rates plus compensation for bearing duration and other interest-rate risks. That decomposition means a similar move in a headline yield can arise from different underlying changes. An analysis that does not separate the possible components is describing a joint movement without identifying what the yield move represented.
Maturity selection is especially important. A shorter Treasury yield may be more sensitive to the expected path of near-term policy rates, while a longer yield can reflect those expectations together with a changing term premium. A curve move can also differ by point on the curve rather than occur as a uniform shift. Therefore, a comparison should identify whether it uses an observed security, a constant-maturity series, a par curve, or a fitted curve, and should avoid treating the resulting number as interchangeable with every other Treasury-rate measure.
Any observed co-movement with Bitcoin remains conditional on the event and the market state. A change in nominal yields may occur alongside changes in currency pricing, inflation compensation, duration demand, liquidity, equity volatility, or a Bitcoin-specific event. Those channels can reinforce, offset, or obscure one another. The appropriate conclusion from a chart is limited to the stated measurement and sample: it can show that variables moved together or apart under those conditions, but it does not establish an enduring causal path or an actionable rule.
Why is real yields bitcoin relationship a separate question?
The real yields bitcoin relationship cannot be inferred automatically from the nominal-yield comparison. Real yields are designed to express a return measure after the inflation-protection feature of the underlying instrument is considered, but the series still depends on maturity, instrument selection, curve methodology, and market conditions. A nominal yield and a real yield with nonmatching maturities may embed different duration exposures; even matched maturities may come from different liquidity conditions and estimation procedures.
Expected inflation deserves its own field rather than a shortcut label. Comparing nominal and real Treasury yields can produce an inflation-compensation measure, yet that measure need not be a pure reading of expected inflation. Risk premiums and liquidity effects can affect it, and different surveys or market-based measures can have different definitions and horizons. If the nominal yield changes while a real yield changes differently, the residual should be described carefully as a constructed compensation measure with limitations, not as an unambiguous message about future consumer prices.
This separation protects against a common analytical error: assigning a single macro meaning to a real-yield move and then transferring that meaning to Bitcoin. The relationship can vary with the reason rates moved, the maturity used, the currency context, the funding environment, and Bitcoin-specific supply and demand conditions. A valid report can state its series and show conditional co-movement, but it should not turn that observation into a stable valuation rule, a forecast, or an asset recommendation.
Why does the term premium deserve its own line?
The term premium is the compensation investors may require for bearing interest-rate risk over a bond’s life. It is not directly observable, so any published value is model-dependent and should be labeled by its source and methodology. Conceptually separating it from expected future short rates helps explain why a longer nominal Treasury yield may change even when the expected policy path is not the only moving part. This is a decomposition framework, not a claim that one estimate is uniquely correct.
Term-premium changes can be associated with shifts in duration demand, uncertainty, risk compensation, market functioning, or the supply-and-demand environment for longer-dated securities. Those possibilities are distinct from a change in expected inflation or an expected sequence of short policy rates. Treating every long-yield move as a direct signal about monetary policy, or as a single risk-on/risk-off switch, compresses several mechanisms into a conclusion the data cannot support without further evidence.
For a comparison with Bitcoin, retain the decomposition instead of relabeling a long yield as “real rates” or “risk appetite.” A reader can record the nominal yield series, the real-yield series, the derived inflation-compensation convention, and the chosen term-premium estimate separately. That makes it possible to say which measurements moved in a selected window and which did not, while preserving the uncertainty created by source choices, model changes, and unobserved factors.
How does broad risk appetite fit into the picture?
Broad risk appetite is not a single price series that can be read from the Dollar Index, a Treasury yield, or Bitcoin alone. It is a contextual description of how investors may be pricing risk across assets, credit, volatility, funding, and liquidity at a given time. Official financial-conditions research likewise treats financial conditions as a combination of variables rather than a single market quote. A rigorous discussion should therefore name the indicators used and the aspect of the environment each one is intended to describe.
This broader context can help explain why simple pairwise correlations are unstable. A change in risk appetite may coincide with currency moves, yield moves, equity moves, and changes in Bitcoin market liquidity, but the direction and strength of those links can depend on the initiating shock. A policy surprise, an inflation surprise, a balance-sheet constraint, a geopolitical event, or a Bitcoin-specific market event may produce different combinations of the same observable variables. The phrase “risk appetite” should not replace that causal work.
Bitcoin-specific conditions also remain part of the observation set. Market access, derivatives positioning, trading liquidity, custody and settlement conditions, protocol developments, and participant behavior can affect its price formation independently of the chosen macro measures. Ignoring those factors and treating a dollar or yield series as a complete explanatory model produces an overconfident narrative. The appropriate framing is a conditional map of concurrent influences, not a ranking of signals or a prescription for acting on them.
How should a conditional comparison be read?
Start with a measurement sheet. It should identify the Dollar Index definition, Treasury maturity and curve source, real-yield source, inflation-compensation convention, term-premium model if one is used, Bitcoin price source, currency denomination, timestamps, frequency, sample dates, and transformation. It should also specify whether the purpose is descriptive comparison, event study, or a different statistical exercise. These details make the work reviewable and prevent labels from silently changing halfway through a chart or table.
Then test the limits rather than assuming stability. Compare multiple disclosed windows, examine whether conclusions change when timestamps or frequency are altered, and distinguish level correlation from return correlation. Flag observations that are sensitive to a small number of unusual periods, data gaps, or methodology changes. A correlation that changes with the sample is not necessarily an error; it is evidence that the relationship may be regime-dependent, conditional, or too coarse to summarize with one number.
The narrow conclusion is the durable one. The Dollar Index, nominal Treasury yields, real yields, expected inflation, term premium, and broad risk appetite are distinct variables that may provide context for Bitcoin when their definitions and limitations are kept visible. They do not deliver a price forecast, a stable relationship claim, a hedge designation, or a recommendation to hold, trade, or avoid any asset. Sound analysis reports the measurement choices, observed conditional co-movement, and unresolved alternatives without pretending that a macro label settles the question.
Disclaimer: This article is educational content from Bitbase Academy, provided for information only. It does not constitute investment, trading, tax, or financial advice. Crypto assets are volatile; assess your own risk. Written as of August 2026; refer to the latest official information.
References
[1] ICE: U.S. Dollar Index ice.com
[2] U.S. Treasury: Interest rate statistics home.treasury.gov
[3] Federal Reserve: TIPS yield curve and inflation compensation federalreserve.gov
[4] New York Fed: Treasury term premia newyorkfed.org
[5] Federal Reserve: financial conditions index research federalreserve.gov