
A global liquidity bitcoin correlation is not a single chart fact. It is a research question that depends on what “liquidity” means, which monetary aggregates are included, how currencies and regions are combined, and how Bitcoin is measured. A careful framework starts with definitions and data choices before it considers any relationship between the series.
What does global liquidity mean?
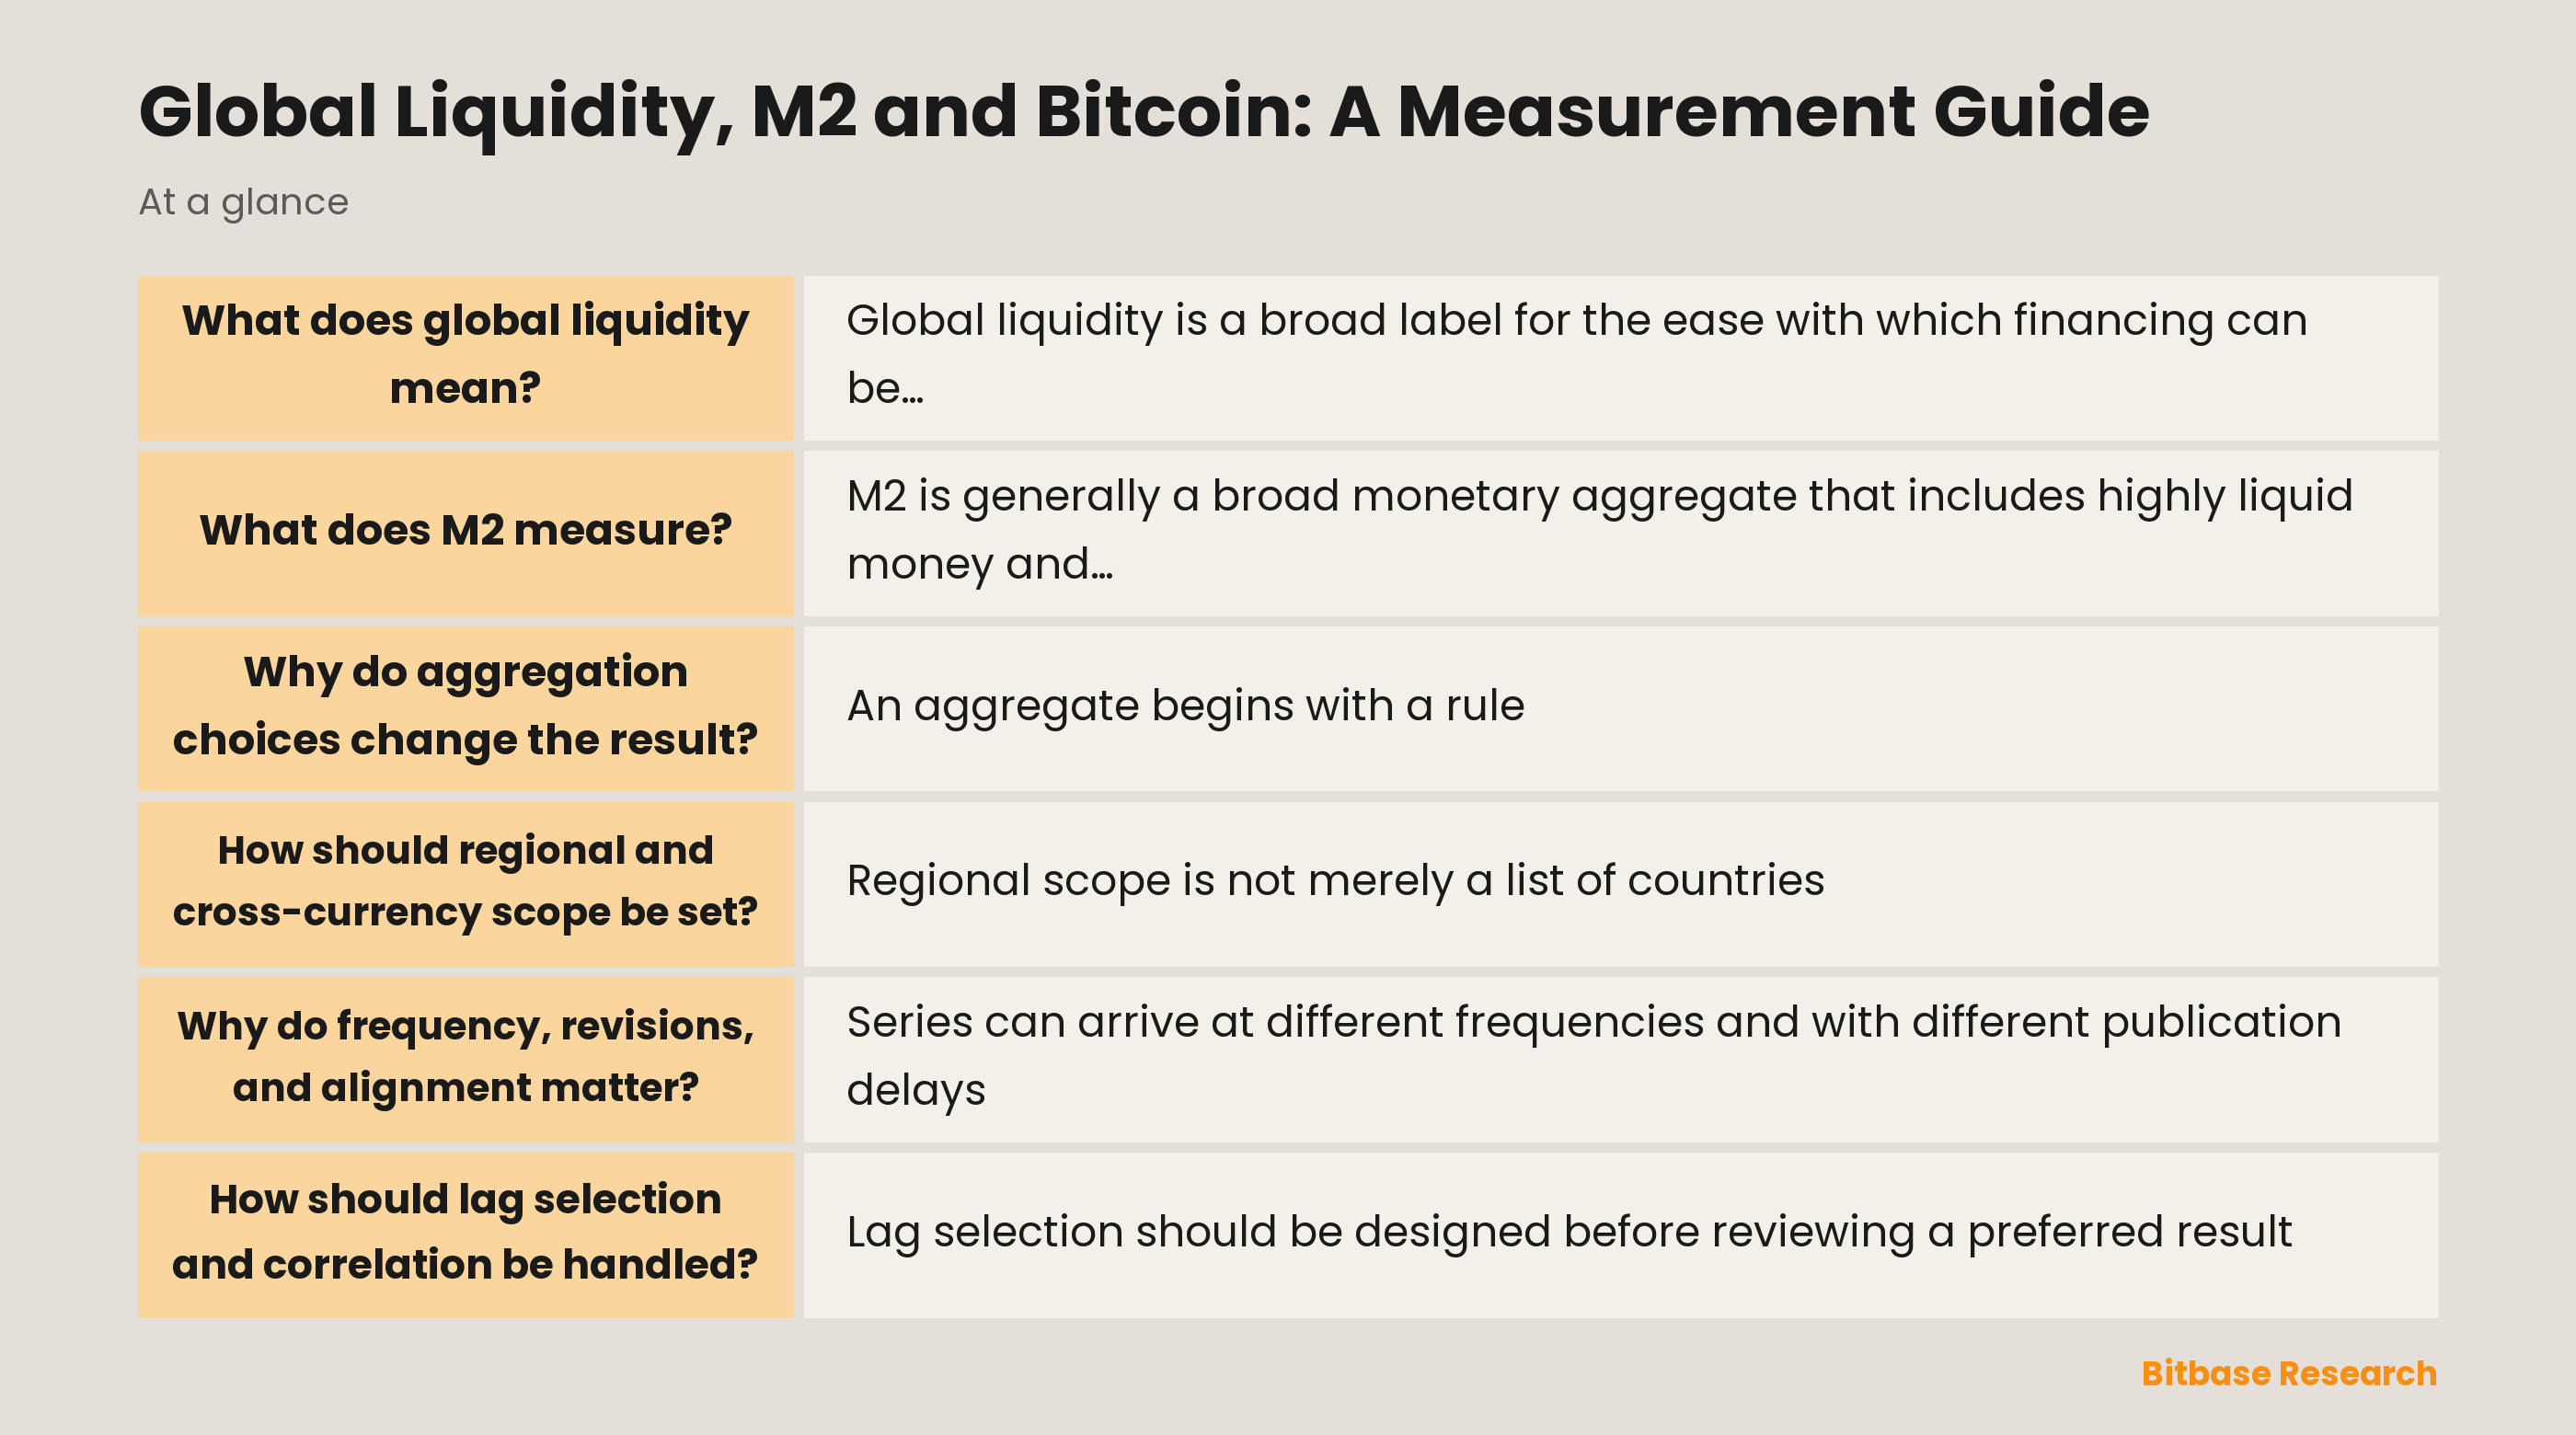
Global liquidity is a broad label for the ease with which financing can be obtained and used across financial markets. It can refer to available credit, the balance sheets of intermediaries, funding in major currencies, market depth, collateral conditions, or the ability of investors and borrowers to convert claims into spending power. Those concepts may move together at times, but they are not interchangeable measurements.
The Bank for International Settlements uses a deliberately narrower statistical meaning in its global liquidity indicators. Its framework tracks credit to non-bank borrowers in major currencies, combining bank lending with funding through international debt securities and focusing particularly on foreign-currency credit outside the issuing currency area. That framework is useful because it states the borrower, currency, and instrument boundaries rather than treating liquidity as a vague sentiment label.
An analyst should therefore name the chosen proxy before comparing it with Bitcoin. A global monetary aggregate, cross-border dollar credit, bank balance-sheet capacity, and a market-based financial-conditions index answer different questions. Combining them under one label can hide changes in coverage and turn a descriptive chart into a conclusion that the inputs do not support.
What does M2 measure?
M2 is generally a broad monetary aggregate that includes highly liquid money and selected near-money claims, but its exact contents are determined by the reporting authority. In the United States, the H.6 release defines M2 through specified deposit and money-market components. In the euro area, the European Central Bank uses a different institutional and instrument scope. The shared name does not make the series identical.
That distinction matters when discussing an m2 money supply bitcoin correlation. A national M2 series measures liabilities within a defined monetary and institutional system. It is not automatically a measure of cross-border credit, offshore funding, market depth, or risk appetite. It may be a relevant input to a broader study, but its interpretation should remain tied to its documented coverage.
M2 is also a stock measure, not a direct observation of how quickly funds are deployed into every asset class. Changes in money holdings can coincide with changes in household portfolios, bank funding, payment preferences, regulation, and accounting classification. Treating a monetary stock as a direct record of marginal demand for Bitcoin skips several economic and behavioral links that would need separate evidence.
Why do aggregation choices change the result?
An aggregate begins with a rule. A researcher must decide whether to use levels, changes, growth rates, indexed series, or deviations from a trend. Each transformation answers a different question and can alter the apparent co-movement. A level chart can reflect long-run scale and inflation, while a change-based chart emphasizes periods of acceleration or deceleration.
The country set also needs to be explicit. A basket can cover selected large monetary areas, a currency union, or a broader group of reporting jurisdictions. It can weight members by economic size, convert them into a common currency, keep them as separate standardized series, or avoid aggregation entirely. None of those decisions is neutral, and each can move the resulting line.
Currency conversion introduces another layer. Converting local monetary aggregates into a common currency can make exchange-rate changes look like changes in the aggregate even when local-currency data are unchanged. Leaving each series in local currency avoids that translation effect but prevents a simple nominal sum. A defensible study documents the conversion rule, the reference currency, and whether the aim is a local monetary comparison or a global funding proxy.
How should regional and cross-currency scope be set?
Regional scope is not merely a list of countries. It determines which issuers, holders, and financial systems influence the measure. National aggregates commonly describe resident sectors within a particular monetary area, while cross-border liquidity measures may focus on non-resident borrowers and foreign-currency obligations. Mixing those scopes without a clear map can double count some activities and omit others.
Cross-currency scope matters especially for dollar funding. The phrase dollar liquidity crypto cycle can be useful as a topic for examining an asserted narrative, but it is not a measurement standard. Dollar credit outside the United States, domestic dollar money, dollar funding costs, and the exchange value of the dollar describe related yet distinct mechanisms. An article should say which one is present rather than relying on the phrase as an explanation.
The same discipline applies to Bitcoin. Bitcoin trades through markets with different currencies, venues, participant types, custody arrangements, and access rules. A comparison can use a common reference currency for consistency, but that choice does not make the measured liquidity variable worldwide or homogeneous. Scope notes should identify what the series represents and what it deliberately leaves outside the frame.
Why do frequency, revisions, and alignment matter?
Series can arrive at different frequencies and with different publication delays. Monetary aggregates may be released on a monthly schedule, while some cross-border credit indicators are less frequent and market data can be observed much more often. Converting every input to a shared frequency is necessary for comparison, but the chosen rule can add smoothing, discard variation, or create artificial alignment.
Data vintages matter as much as frequency. Official releases can revise history, update seasonal adjustments, alter component treatment, or correct reporting breaks. A chart built today from revised data may not match what a researcher could have observed at an earlier point. Good documentation records the retrieval date, the release vintage, the transformation, and the rule used when an observation was unavailable.
Calendar alignment also requires restraint. Matching a month-end Bitcoin observation with a monetary series does not show that both were known at the same time, and using the release date instead of the reference period answers another question. Analysts should state whether they align by observation period, availability date, or a lagged information set, and should avoid presenting the choice as self-evident.
How should lag selection and correlation be handled?
Lag selection should be designed before reviewing a preferred result. A researcher can test a small, economically motivated set of lead and lag windows, then report the full sensitivity rather than only the strongest relationship. Searching many transformations, regions, frequencies, and lags until one looks persuasive creates a selection problem: the displayed correlation may be an artifact of the search process.
Correlation summarizes co-movement; it does not identify a mechanism. Bitcoin and a liquidity proxy can move together because of common shocks, shifts in risk appetite, policy expectations, exchange-rate movements, changes in leverage, regulatory news, or measurement timing. The same observed pattern is consistent with several explanations, including chance and reverse causation.
To move from description toward causal inference requires more than a visual overlay. It requires a clearly stated mechanism, suitable controls, a defensible identification design, and robustness checks that can fail. Even then, results are conditional on the sample, definitions, and assumptions. For an Academy explainer, the responsible conclusion is usually that a relationship is worth investigating, not that one series determines the other.
What can a careful dashboard conclude?
A useful dashboard can show the chosen liquidity proxy, its coverage notes, a Bitcoin reference series, the shared frequency, and the transformations applied to each. It can offer multiple definitions side by side rather than forcing them into a single composite. It can also display revision notes and gaps so readers see where the data are strong, incomplete, or not directly comparable.
The dashboard should separate observation from interpretation. It can say that two defined series changed in the same direction over a specified sample or that their relationship varied across transformations. It should not imply that a single visual establishes a stable law, proves causality, or provides a future path. This is particularly important when a broad label obscures multiple underlying channels.
The most durable takeaway is methodological. Define the liquidity concept, state the monetary and geographic scope, preserve the data vintage, choose frequency and lags transparently, and test alternatives before interpreting co-movement. That process makes a global liquidity bitcoin correlation study more auditable and makes its limits visible, even when the available evidence is descriptive rather than causal.
Disclaimer: This article is educational content from Bitbase Academy, provided for information only. It does not constitute investment, trading, tax, or financial advice. Crypto assets are volatile; assess your own risk. Written as of August 2026; refer to the latest official information.
References
[1] Bank for International Settlements: Global Liquidity Indicators bis.org
[2] Federal Reserve: H.6 money stock measures federalreserve.gov
[3] Federal Reserve: H.6 release and methodology notices federalreserve.gov
[4] European Central Bank: Monetary aggregates data.ecb.europa.eu
[5] IMF: Monetary and Financial Statistics Manual elibrary.imf.org