
Social dominance and token mindshare are labels for a share of attention, not a share of value. A useful measure begins by defining the corpus, the entity-matching rule, the attention unit, the time window, and the denominator. Without those choices, a percentage can look precise while describing very different things. This article explains how to read crypto social dominance, what a crypto mindshare tracker must disclose, and why neither metric is a price signal or a substitute for primary evidence.
What does crypto social dominance measure?
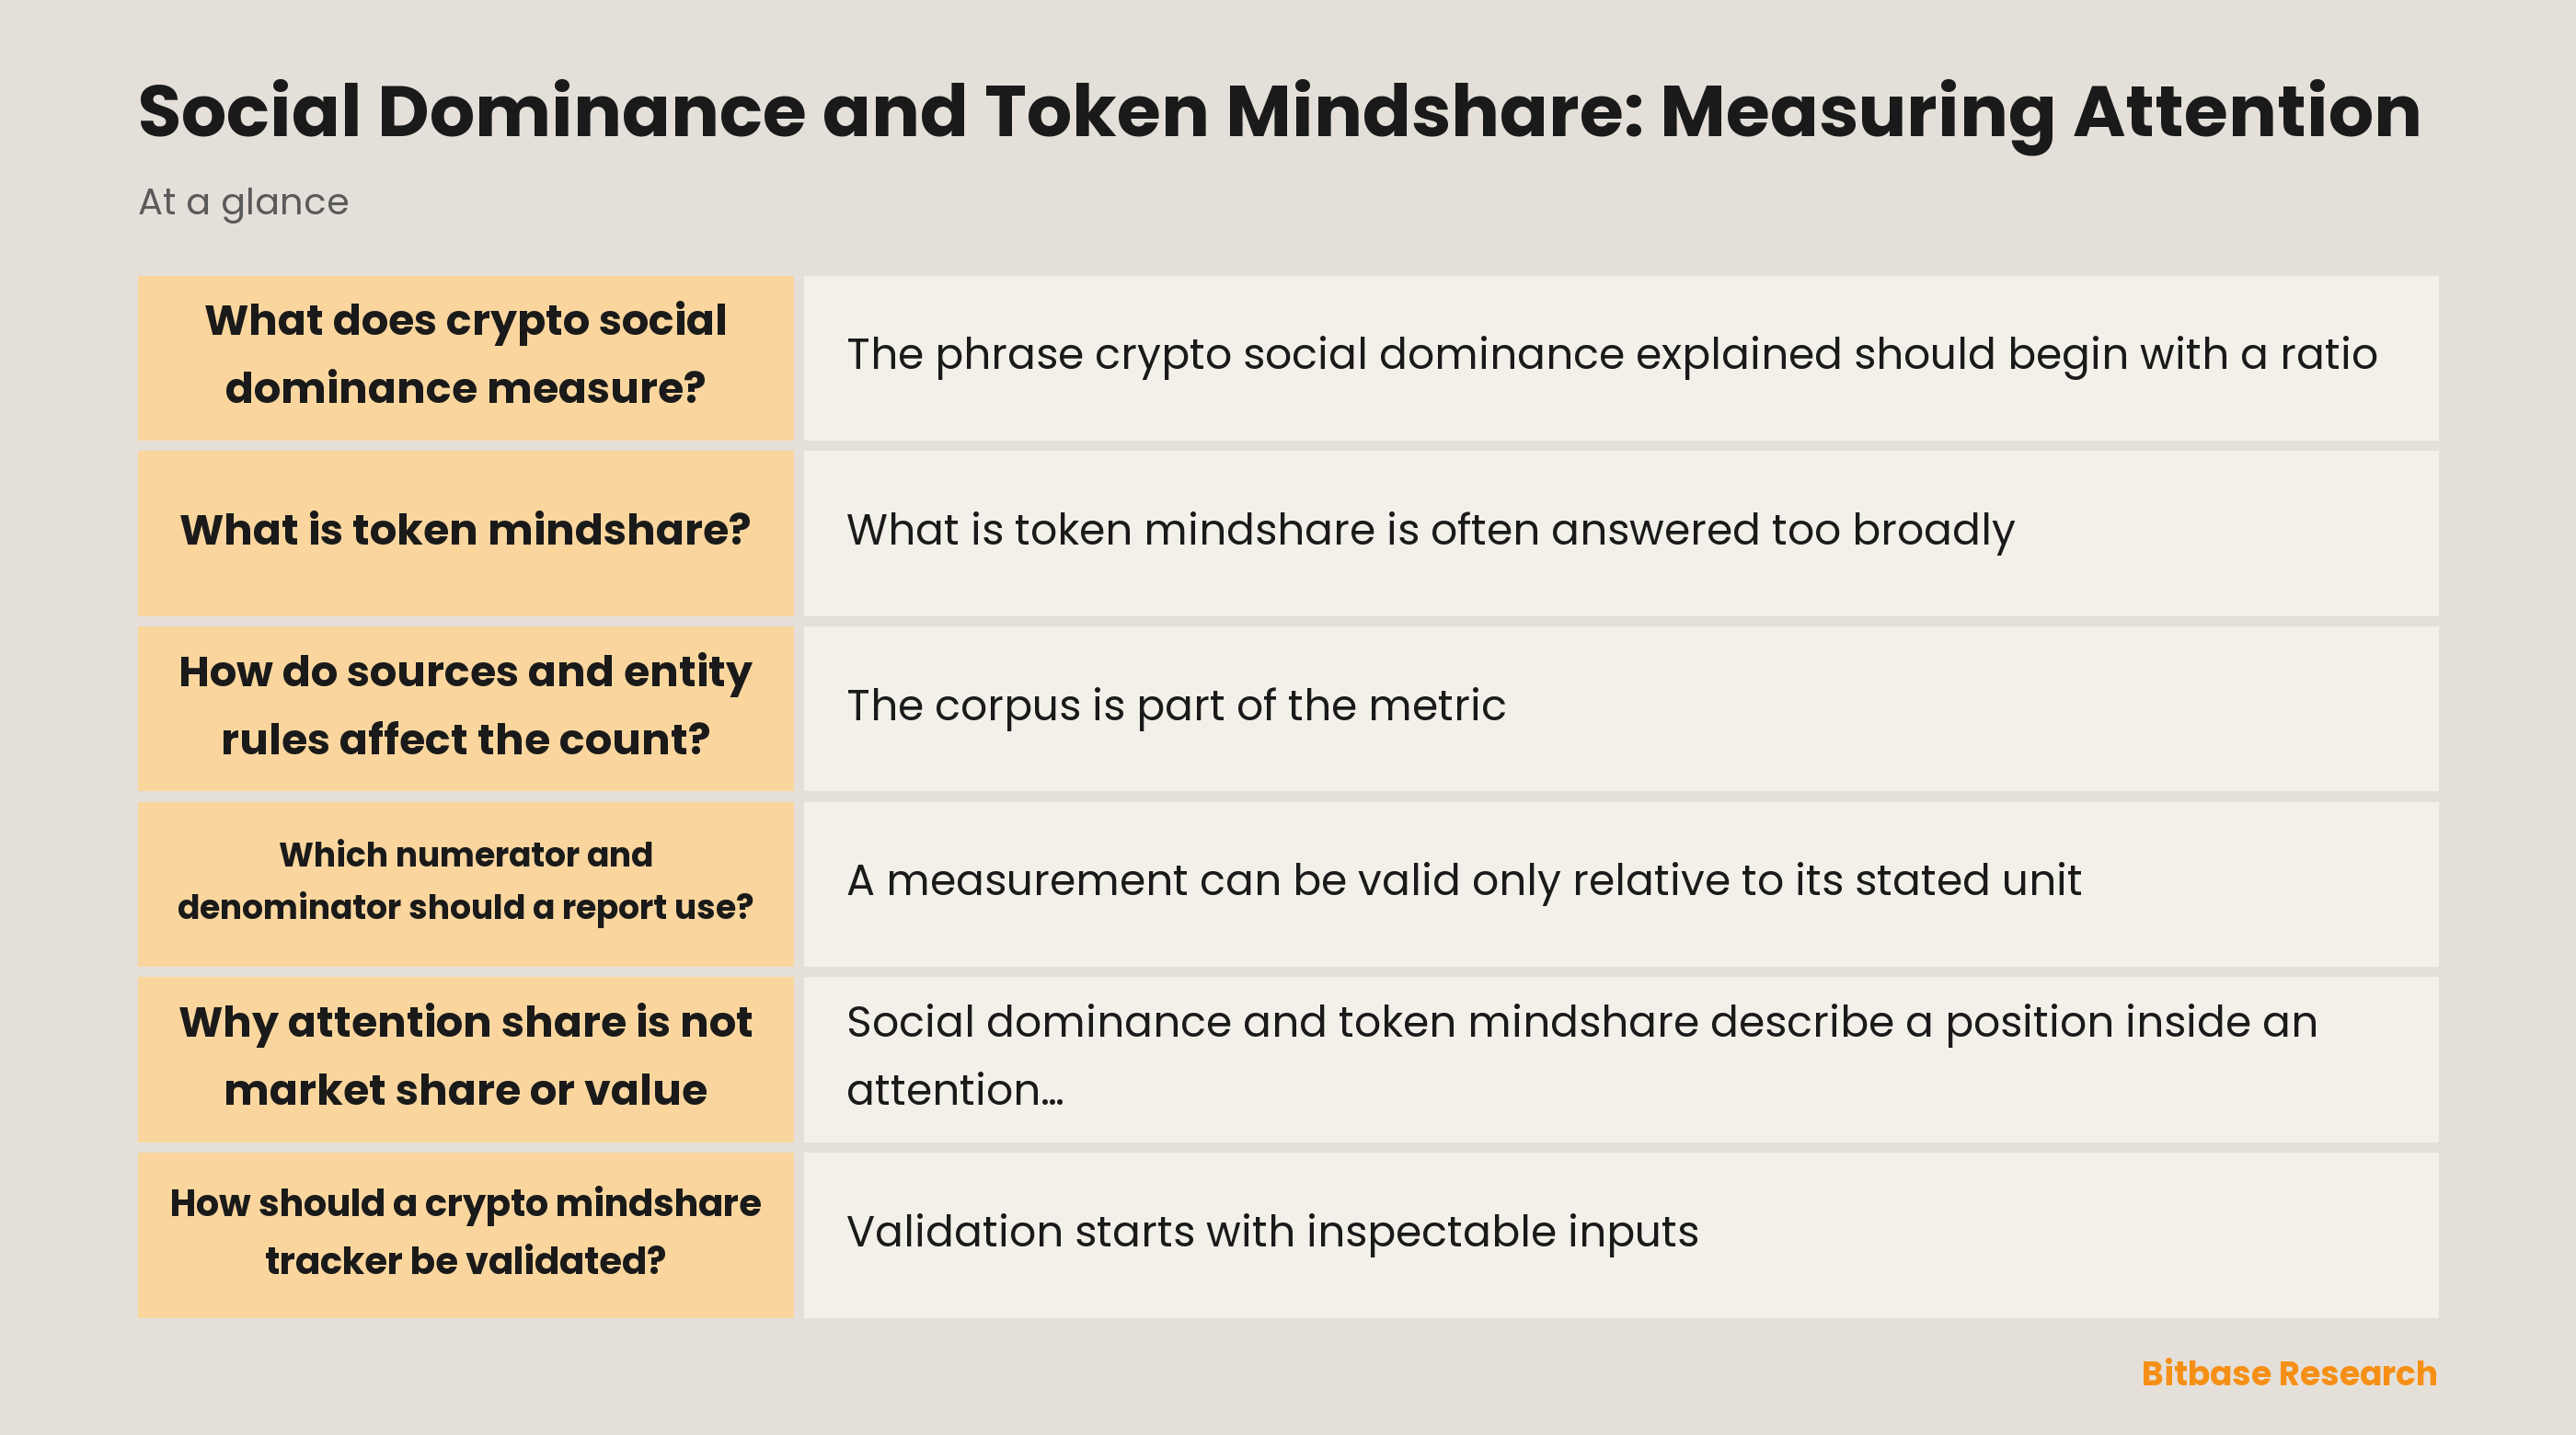
The phrase crypto social dominance explained should begin with a ratio, not with a leaderboard. In its simplest form, social dominance is the attention attributed to one entity divided by the attention attributed to a defined comparison set during a defined period. If the unit is qualifying posts, a report might write: entity posts divided by all qualifying posts in the selected corpus, multiplied by 100. That is a measurement convention, not a universal protocol standard.
Every noun in that ratio needs a definition. “Entity” may mean a protocol, a token symbol, a company name, a chain, or a topic. “Attention” may mean posts, distinct authors, replies, reposts, reactions, views, search interest, or an internally weighted combination. “All” may mean all matched crypto entities, all tracked entities, all public messages from selected sources, or only messages in a chosen language. Changing any one of those terms changes the number.
The result therefore describes a share inside a dataset, not an objective amount of public interest. A project can have a large share in a narrow, highly active corpus and a small share in a broader one. A high percentage can come from more mentions of the entity, fewer mentions of the rest of the set, a smaller denominator, a query change, or a data-access change. The first question is always: share of what, measured how, and compared with whom?
What is token mindshare?
What is token mindshare is often answered too broadly. In practice, mindshare is an informal label for attention allocated to a token, protocol, theme, or brand. It can be measured using text mentions, author counts, interaction counts, search interest, community activity, news coverage, or several of those inputs. The label does not tell the reader which one was used.
For that reason, a crypto mindshare tracker should disclose its operational definition before presenting a chart. It should say whether it measures mentions, unique authors, engagement, search behavior, or a composite; which sources feed the measure; whether the sources are public and complete; whether the metric is document-weighted or author-weighted; and whether the comparison set is fixed or changes over time. “Mindshare” without that metadata is a name rather than a measurement.
Mindshare also differs from sentiment and from topical relevance. A text can mention an entity frequently because of a security incident, a governance dispute, a listing rumor, a technical release, or unrelated spam. It may have high attention without positive sentiment, high interaction without many distinct authors, or high search interest without much public discussion. Reporting the separate dimensions makes the result more interpretable than combining them into one unexplained score.
How do sources and entity rules affect the count?
The corpus is part of the metric. A collection based on public short posts observes a different population from a set of public channel messages, news text, search queries, documentation traffic, or onchain activity. None is automatically “the crypto conversation.” Visibility rules, access limits, moderation, language coverage, retention, and collection time all determine which attention is observable.
Entity matching is equally important. A name can have spelling variants, abbreviations, translations, ticker collisions, common-word meanings, and changing brand names. A strict query reduces false positives but can miss valid discussion. A broad query captures more variants but can include unrelated uses. A responsible report records the query list, topic-versus-term choice, excluded meanings, language rules, and the date when those decisions were made.
Duplicates and coordination also matter. Reposts, forwarded messages, syndicated headlines, bot templates, and repeated campaigns can increase document counts without indicating many independent observers. Removing every duplicate may erase genuine diffusion; keeping every duplicate may make distribution mechanics look like attention. A report should preserve original identifiers where possible, flag near-duplicates, and show whether its denominator is based on documents, authors, interactions, or a weighted combination.
Which numerator and denominator should a report use?
A measurement can be valid only relative to its stated unit. A post-share version uses matched posts as both numerator and denominator. An author-share version counts distinct matched authors. An interaction-share version adds selected reactions, replies, or reposts, but then must state which interaction types are included and whether one account can create many of them. A search-share version needs to explain the platform’s normalization and the chosen term or topic.
The comparison set is the most easily hidden decision. A share of all posts about ten tracked entities is not comparable to a share of all posts that contain any crypto term. Adding or removing one large entity can move every other percentage even when its own count stays unchanged. A fixed universe makes longitudinal comparisons easier; a changing universe may capture newly relevant entities. Neither is automatically correct, but the rule must be visible.
Time is part of the denominator too. A one-hour window can show an event spike, while a thirty-day window can dilute it. Rolling windows overlap and can make changes appear smoother than independent periods. Low-volume windows can be dominated by a handful of posts. Reports should display counts beside percentages, state the time zone and cutoffs, and avoid treating a small denominator as a stable signal.
Why attention share is not market share or value
Social dominance and token mindshare describe a position inside an attention measurement. They do not measure token supply, network use, revenue, ownership, liquidity, security, governance quality, or economic value. Market share uses a different denominator and a different underlying claim. Treating a social percentage as a share of an industry or as a measure of “who is winning” changes the question without changing the chart.
Attention can rise for many reasons that are not favorable. People may be reacting to downtime, a controversy, a rumor, an exploit report, an airdrop discussion, a migration, or a marketing campaign. Attention can also fall when discussion moves to private channels, another language, a different platform, or a different wording. A ratio alone cannot distinguish those cases.
The same caution applies to links with price. An attention series and a price series can both respond to a third event; attention can follow a price movement; the selected time window can make a correlation appear or disappear; and a measure may change because the instrument changed. An observed relationship is not a causal mechanism, and it is not a trading instruction. This article treats attention as a conditional observation, not as a prediction.
How should a crypto mindshare tracker be validated?
Validation starts with inspectable inputs. The report should retain a query specification, source list, access dates, sample counts, language coverage, duplicate policy, bot or coordination flags, entity mappings, metric version, and a record of any backfills or changes. A reader should be able to understand what was counted even if the underlying raw text cannot be redistributed.
Then test sensitivity. Compare document share with author share; compare a strict entity query with a broader query; inspect the result with and without near-duplicates; and compare more than one time window. If an entity changes rank only under one reasonable configuration, that instability is part of the result. Sensitivity is not a defect to hide; it describes how dependent the conclusion is on design choices.
Cross-source comparison can diagnose rather than confirm a single truth. If public posts, public channels, search interest, and news text move together, the report can state that the selected measures co-moved. If they diverge, it should retain that divergence rather than average it away. The goal is an audit trail of attention measurement, not a universal popularity verdict.
How should readers use an attention report?
Start with six checks: What is the entity rule? What is the attention unit? What is the numerator? What is the denominator? What is the time window? Which sources and languages were observable? If a report cannot answer those questions, its percentage is hard to compare with another report or with itself after a method change.
Next separate level, change, and uncertainty. A level is a share inside a particular corpus. A change may reflect new discussion, a denominator shift, a query update, a source outage, or a language change. Uncertainty includes missing sources, ambiguous matches, bot activity, and small samples. Counts, confidence intervals where appropriate, and sensitivity tables are often more informative than a single ranking.
Finally, keep the claim narrow. Crypto social dominance explained is a way to describe selected public attention under a stated method. Token mindshare is a useful shorthand only after its denominator and inputs are disclosed. Neither metric establishes value, quality, truth, future demand, or price direction. A careful reader treats the chart as one conditional measurement alongside primary documentation, technical evidence, and context—not as a shortcut around judgment.
Disclaimer: This article is educational content from Bitbase Academy, provided for information only. It does not constitute investment, trading, tax, or financial advice. Crypto assets are volatile; assess your own risk. Written as of August 2026; refer to the latest official information.
References
[1] Google Trends: FAQ about Google Trends data support.google.com
[2] Google Trends: Compare search terms and topics support.google.com
[3] Social Media Engagement and Cryptocurrency Performance arxiv.org
[4] Attention Inequality in Social Media arxiv.org