Velocity is a turnover rate: how many times an average unit changes hands in a period. Sinks are the parts of a token's design that give a holder a reason to stop passing it on. They are the same question asked from opposite ends. This article defines velocity, shows how chain data approximates it and where that approximation misleads, then works through demand sinks and supply sinks and what each costs.
What velocity actually measures
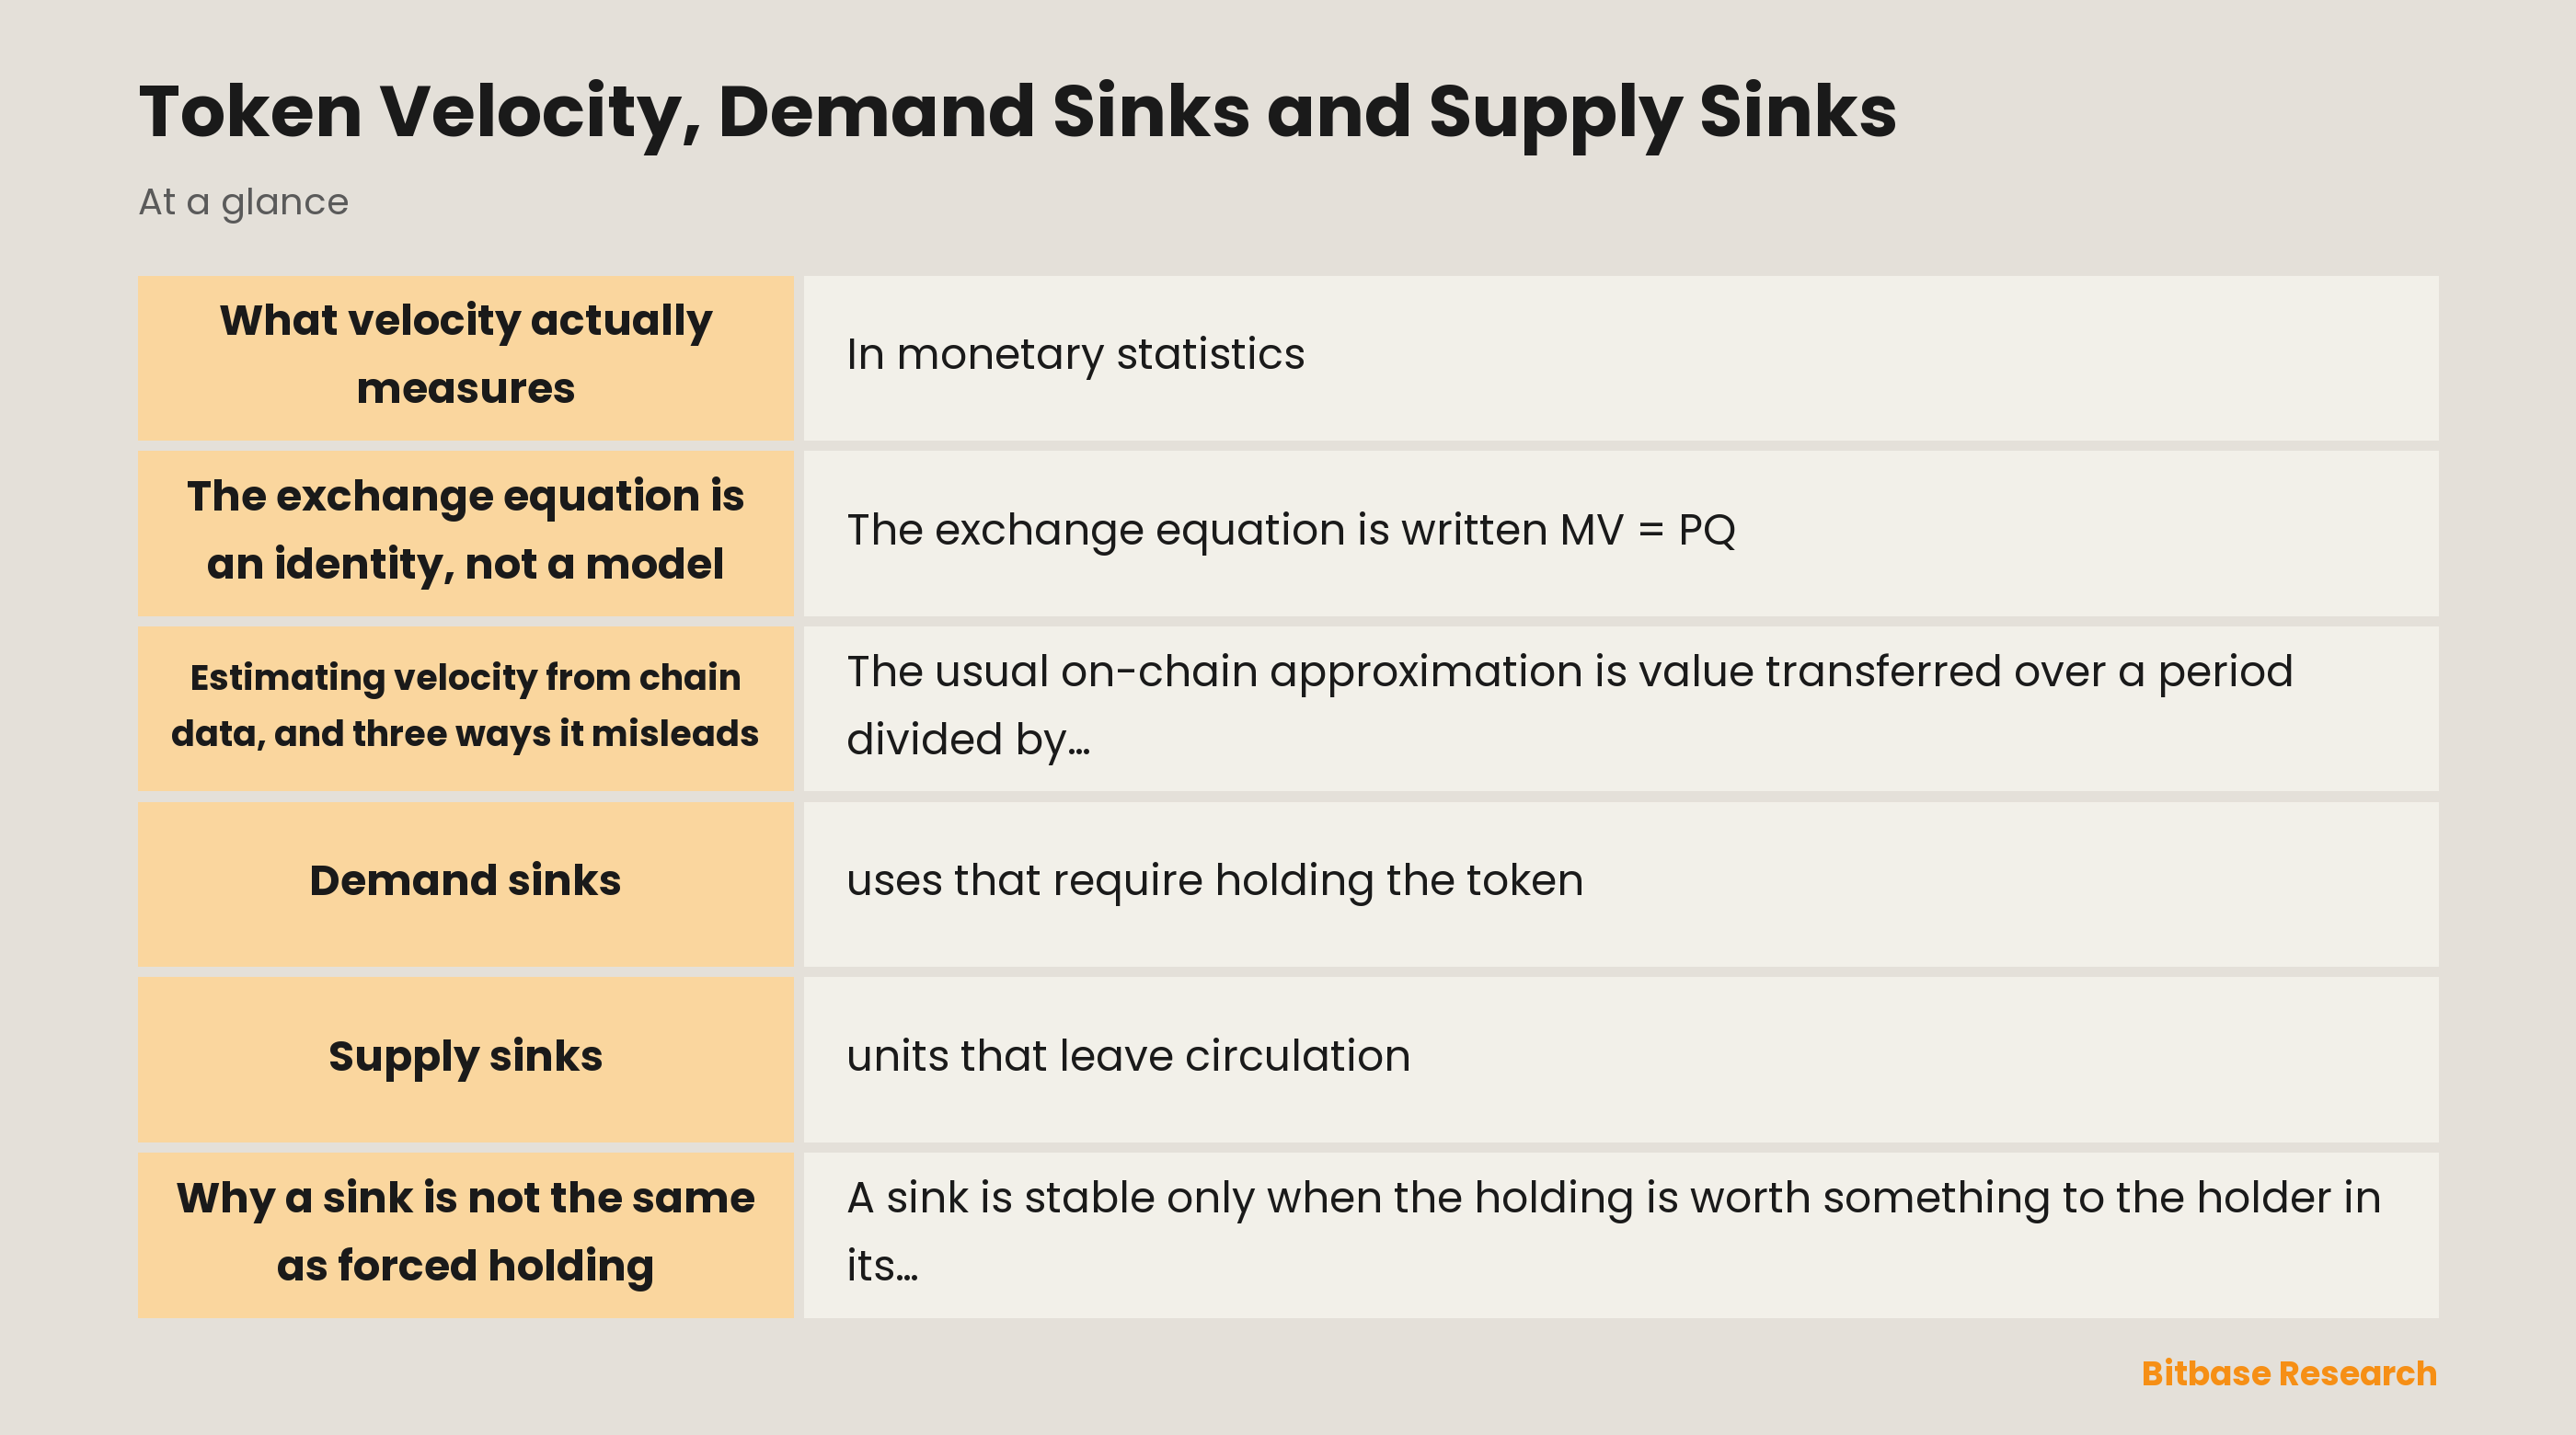
In monetary statistics, velocity is a turnover ratio. The Federal Reserve Bank of St. Louis publishes it as the frequency at which one unit of currency is used to buy goods and services in a given period, calculated as nominal output divided by the money stock. It is a rate rather than a quantity, and it is derived from two other numbers rather than observed directly.
The token version keeps the same shape. Take the value transferred over a period and divide it by the value of the circulating supply. If a network settles as much value in a year as its circulating supply is worth, velocity is 1. If it settles four times as much, velocity is 4. Nothing about the token itself has changed between those two readings.
Notice what that ratio contains. Both halves can move, so a single reading tells you very little on its own. Velocity rises when the same holders transact more often, and it rises when the float shrinks while transacting stays flat. The number cannot tell those two apart, and neither can anyone quoting it at you.
The reason velocity gets attention in token design is that it describes an outcome rather than a cause. Units move quickly when nothing in the system rewards keeping them still. Everything below is about what that stillness is actually made of.
The exchange equation is an identity, not a model
The exchange equation is written MV = PQ: the money stock M times its velocity V equals the price level P times the quantity of transactions Q. Most attempts to value a token from first principles start here.
The detail that matters is how V gets its value. As a Federal Reserve Bank of Richmond survey of the equation's history puts it, when the relation is stated as the identity MV = PQ, velocity is defined as V = PQ / M precisely so as to render the equation a tautology. V is not measured on its own; it is whatever number makes the two sides agree.
That has a consequence people skip over. An identity cannot be violated, and it cannot be tested. It says total payments equal the value of what was bought, which is bookkeeping. Bookkeeping keeps your numbers consistent with each other. It does not produce them.
To get from the identity to a valuation you have to add assumptions the identity does not supply: that the token is the only way to pay for some well-defined set of transactions, that the size of that set can be forecast, and above all that velocity is a stable figure you choose. The last assumption does all the work. Halve the velocity you assume and the answer doubles, and the equation cannot tell you which is right.
There is a matching problem underneath as well. M in the identity is money held for transacting. A token's circulating supply includes units posted as collateral, units exchanges hold for customers, and units nobody intends to spend. Substituting one for the other is a modelling decision, not an observation. MV = PQ keeps your terms consistent; it does not return a number.
Estimating velocity from chain data, and three ways it misleads
The usual on-chain approximation is value transferred over a period divided by circulating market value, or, in units, transfer volume divided by circulating supply. Both series are published, which is why the estimate is popular. It is also distorted in at least three directions, and the distortions do not cancel out.
First, a large share of trading never touches the chain. The Bank for International Settlements notes that centralised exchanges keep their order books off-chain, as traditional venues do, and lists the large number of off-chain transactions among the reasons basic crypto figures lack transparency and consistency. When two customers of the same exchange trade with each other, balances move inside a database and the chain records nothing. For a token held mostly on exchanges, on-chain velocity understates turnover.
Second, the obvious repair, using reported exchange volume instead, imports a worse problem. A study in the NBER working paper series applied statistical tests for fabricated trades across 29 exchanges and estimated wash trading at about 53.4% of volume on unregulated first-tier venues and about 81.8% on second-tier ones. Velocity built on that volume measures reporting behaviour rather than usage.
Third, the same unit gets counted several times. A raw transfer total includes change returning to the sender, wallets consolidating their own funds, and exchanges reshuffling cold storage. Coin Metrics maintains an adjusted transfer value for exactly this reason: it discounts outputs paid back to an address that was also an input, drops outputs spent within an hour of being created, and strips cold-wallet shuffles. The adjusted series and the raw series answer different questions.
The workable rule is to treat any velocity figure as an estimate that travels with its recipe. State which volume series and which supply series went into it, keep the recipe fixed, and compare a token with its own history rather than with another token measured by somebody else's method.
Demand sinks: uses that require holding the token
A sink, borrowing the word from the way it is used for carbon, is somewhere units go and stay. A demand sink works from the holder's side: to get something you want, you have to acquire units and keep holding them for as long as you want it. The test sits in that second clause. A reason to buy is not a sink. A reason to keep is.
Staking is the clearest case. On Ethereum, activating a validator means depositing 32 ETH, and getting it back is not instant: an exit queues behind everyone else leaving at the same time, and the protocol sweeps at most 16 withdrawals per block. Whatever else it does, that converts a decision to sell into a decision to sell later.
Collateral and access requirements do the same job with different plumbing. Units posted as collateral in a lending market cannot be spent while the loan is open. Fee discounts, tiered access and entry deposits all require a balance to sit somewhere and stay there. These sinks scale with the size of the activity rather than with the number of holders, so they grow and shrink with usage.
Governance locking is the most explicit of the three. Curve's vote-escrow design lets a holder lock CRV for anything from one week to four years; the veCRV received in return is not transferable, decays as the lock runs down, and the original CRV comes back only once the lock expires. In exchange the locker gets voting power, boosted rewards and a share of protocol fees. The sink holds for exactly as long as those are worth the illiquidity.
Supply sinks: units that leave circulation
Demand sinks keep units in somebody's hands. Supply sinks take them out of everyone's hands, either permanently or for a fixed term. The distinction matters because the two fail in different ways.
Burning is the permanent version. Under EIP-1559, every Ethereum transaction pays a base fee that does not go to the block producer at all; the specification states that the base fee is always burned, meaning destroyed by the protocol. The size of that sink is set by how much the network is used, which makes it a variable tied to activity rather than a fixed schedule.
Vesting and lockups are the fixed-term version. Allocations to teams, investors and treasuries are released over a schedule that often opens with a cliff, a first stretch in which nothing unlocks at all. Until each release date those units exist in total supply but not in circulating supply. That is a sink with an expiry date printed on it, which makes it a different object from a burn even though both shrink today's float.
Treasuries are the ambiguous version. Units the project holds itself, including liquidity positions the protocol owns rather than rents from outside providers, are on nobody's sell list today. But the holder is an organisation that can decide otherwise, so a treasury is a sink for as long as whoever governs it says it is. When you read a float number, it is worth knowing which of these three categories each locked unit belongs to.
Why a sink is not the same as forced holding
A sink is stable only when the holding is worth something to the holder in its own right. If the only reason to keep units is the cost of leaving, what exists is not a floor but a countdown, and the schedule of that countdown is usually public.
A short test separates the two. Ask what a holder receives while holding, who pays for it, and what happens if that payment stops. If the answer to the first question is emissions of the same token, the sink is funded by dilution: it moves units between pockets instead of creating a reason to keep them. Sinks paid out of fees from real usage survive a change of mood; sinks paid out of new issuance compete with their own cost.
Sinks also have side effects, and the first is thinner liquidity. Every locked unit is a unit a market maker cannot quote against. A design that succeeds in locking a large share of supply ends up with a book in which the same order moves the price further in whichever direction it pushes. That cost lands on everyone who eventually needs to exit, including the holders the lock was meant to reward.
The second is the unlock cliff. A lock with a single release date gathers the decisions of thousands of holders into one moment. The date is public, so nobody is surprised by it; what nobody knows beforehand is how many of those holders were locked because they wanted to be and how many because they had to be. Staggered releases spread that out, a cliff concentrates it.
The third is that locking rearranges who decides. Under vote-escrow, voting power is a function of how long you cannot leave, so the people setting the rules are, by construction, the people least able to exit under them. That is the intent of the design. It is also a shift in control that ordinary holders never vote on, and it belongs in your reading of the token's governance as much as in your reading of its supply.
The bottom line
Velocity is a turnover ratio, and the exchange equation that contains it is an accounting identity in which velocity is the residual, which is why it cannot deliver a valuation on its own. Chain-based estimates are distorted by off-chain trading, by fabricated volume and by double counting, so a figure only means something with its recipe attached. Demand sinks require a holder to keep units in order to get something; supply sinks remove units outright; only the first kind survives the incentive being withdrawn. Read every sink for what the holder gets, who pays for it, and what it costs in liquidity and unlock risk.
Disclaimer: This article is educational content from Bitbase Academy, provided for information only. It does not constitute investment, trading, tax, or financial advice. Crypto assets are volatile; assess your own risk. Written as of August 2026; refer to the latest official information.
References
[1] Velocity of M2 Money Stock (M2V), FRED fred.stlouisfed.org
[2] Thomas M. Humphrey, Algebraic Quantity Equations Before Fisher and Pigou, Federal Reserve Bank of Richmond Economic Review richmondfed.org
[3] Bank for International Settlements, The crypto ecosystem: key elements and risks bis.org
[4] Lin William Cong, Xi Li, Ke Tang and Yang Yang, Crypto Wash Trading, NBER Working Paper 30783 nber.org
[5] Coin Metrics Data Encyclopedia, Transfer Value (Adjusted Transfer Value) coinmetrics.io
[6] ethereum.org, Staking withdrawals ethereum.org
[7] EIP-1559: Fee market change for ETH 1.0 chain eips.ethereum.org
[8] Curve Knowledge Hub, What is veCRV? docs.curve.finance